Building Marketing Reports Using Google Analytics Data: A Step-by-Step Guide

Google Analytics is an essential tool for modern marketers, offering immense insights and data for building effective marketing reports. Creating comprehensive marketing reports using Google Analytics data empowers businesses to make data-driven decisions. This tool provides a range of metrics that can help track user behavior, traffic sources, and campaign performance.
- Fundamentals of Google Analytics for Marketing Reports
- Understanding Google Analytics Structure
- Key Metrics and Dimensions in Google Analytics
- Setting Up for Effective Tracking
- Setting Goals and Conversions
- Implementing Event Tracking
- Integrating Google Analytics with Other Tools
- Building the Report Framework
- Choosing the Right Report Type
- Customizing Dashboards and Widgets
- Creating Meaningful Segments
- Analyzing Audience Insights
- Demographics and User Behavior
- Acquisition Channels Analysis
- User Flow and Path Analysis
- Tracking Campaign Performance
- Monitoring Real-Time Campaign Data
- Assessing Campaigns with Attribution Models
- Optimizing for Better Outcomes
- Engagement and Content Analysis
- Evaluating Landing Pages and Bounce Rate
- Analyzing Content Performance
- Conversion Tracking and E-commerce Analytics
- Measuring Conversion Rates
- Understanding E-commerce Data
- Reporting Automation and Visualization
- Automating Reports with Google Analytics API
- Using Data Visualization Tools
- Advanced Analysis Techniques
- Enhanced E-commerce Tracking
- Applying Advanced Segments and Multi-Channel Funnels
- Utilizing Machine Learning for Data Insights
- Actionable Insights and Report Communication
- Translating Data into Business Strategies
- Presenting Data to Stakeholders
One key benefit of Google Analytics is the ability to customize reports to meet specific business needs. By leveraging dimensions and metrics, marketers can create detailed and relevant reports that offer valuable insights. Customizing these reports ensures alignment with business objectives and provides clarity on marketing performance.

Integrating Google Analytics with other tools can further enhance the depth of reporting. This integration allows for a holistic view, combining web analytics with other data sources to provide a more complete picture. Utilizing these integrations makes it possible to gain deeper insights and optimize marketing strategies effectively.
Google Analytics is a powerful tool for tracking and analyzing website traffic. This section covers the basic structure of Google Analytics and its key metrics and dimensions, essential for creating comprehensive marketing reports.
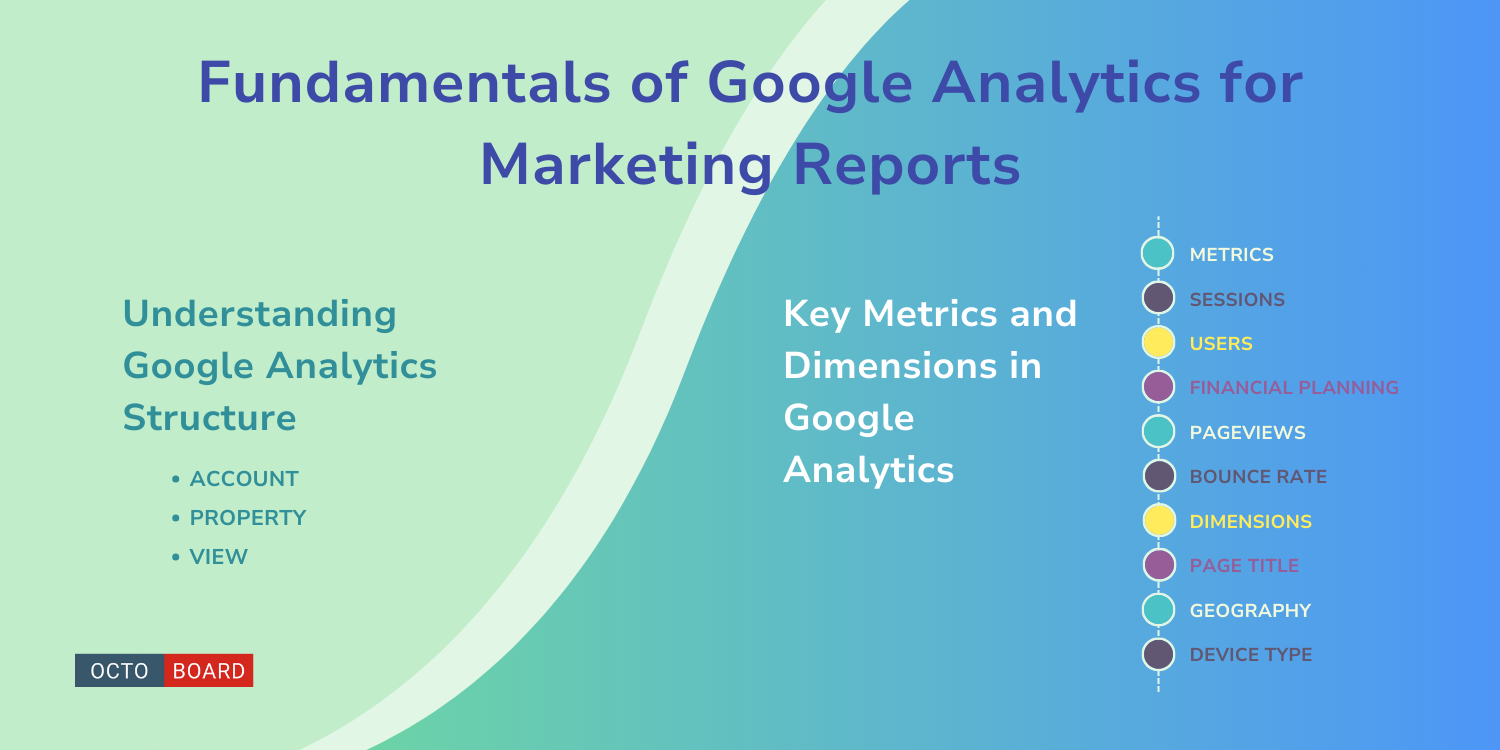
Google Analytics organizes data into a hierarchy that helps users see detailed information about their website traffic. The core structure consists of Account, Property, and View.
Account is the highest level of organization, representing a brand or business.
Property refers to a website, mobile app, or device like a point-of-sale system.
Each property can have multiple Views, which are filtered perspectives of the data, useful for separate reporting needs.

Regular maintenance of Views helps ensure data accuracy by excluding internal traffic and applying filters based on different usage scenarios. Proper setup of these elements allows for more accurate and actionable insights.
Metrics are quantitative measurements such as Sessions, Users, Pageviews, and Bounce Rate. They help marketers understand user engagement and website performance.
Dimensions classify and categorize data. Examples include Page Title, Geography, and Device Type.
Combining metrics and dimensions provides a detailed view of user interactions.

For instance, analyzing Sessions by Geography reveals where the audience is located.
Visualization tools within Google Analytics, like custom dashboards and reports, can help in interpreting complex data effectively.
To effectively track marketing efforts using Google Analytics, it's essential to configure your account for accurate data collection and analysis. Key steps include setting goals and conversions, implementing event tracking, and integrating Google Analytics with other tools to enhance data insights.
Setting goals in Google Analytics helps measure the success of specific actions users take. Goals can include form submissions, newsletter sign-ups, and completed purchases.
Navigate to the "Admin" section, select the desired view, and click on "Goals." Create a new goal and choose the type that suits your needs: destination, duration, pages/screens per session, or event.
Define the details, such as the funnel steps, for more advanced tracking. Ensure goals align with business objectives to generate valuable insights. Regularly review and update goals to reflect changing business priorities.
Event tracking monitors user interactions on your website, such as clicks, video plays, and downloads. These interactions provide deeper insights into user behavior.
Start by identifying the events you want to track. Use Google Tag Manager to streamline the implementation process. Create a new tag, select "Universal Analytics," set the track type to "Event," and define the event category, action, and label.
Test the setup using Google Tag Manager's Preview mode to ensure accuracy before publishing. Event tracking enhances the understanding of user engagement beyond standard page views.
Integrating Google Analytics with other tools amplifies data analysis and reporting capabilities. Common integrations include Google Ads, Google Search Console, and CRM systems.
For Google Ads, link the accounts to import cost data and track campaign performance. This integration provides insights into ROI and effective ad spending. Google Search Console integration offers keyword performance and ranking data directly in Google Analytics.
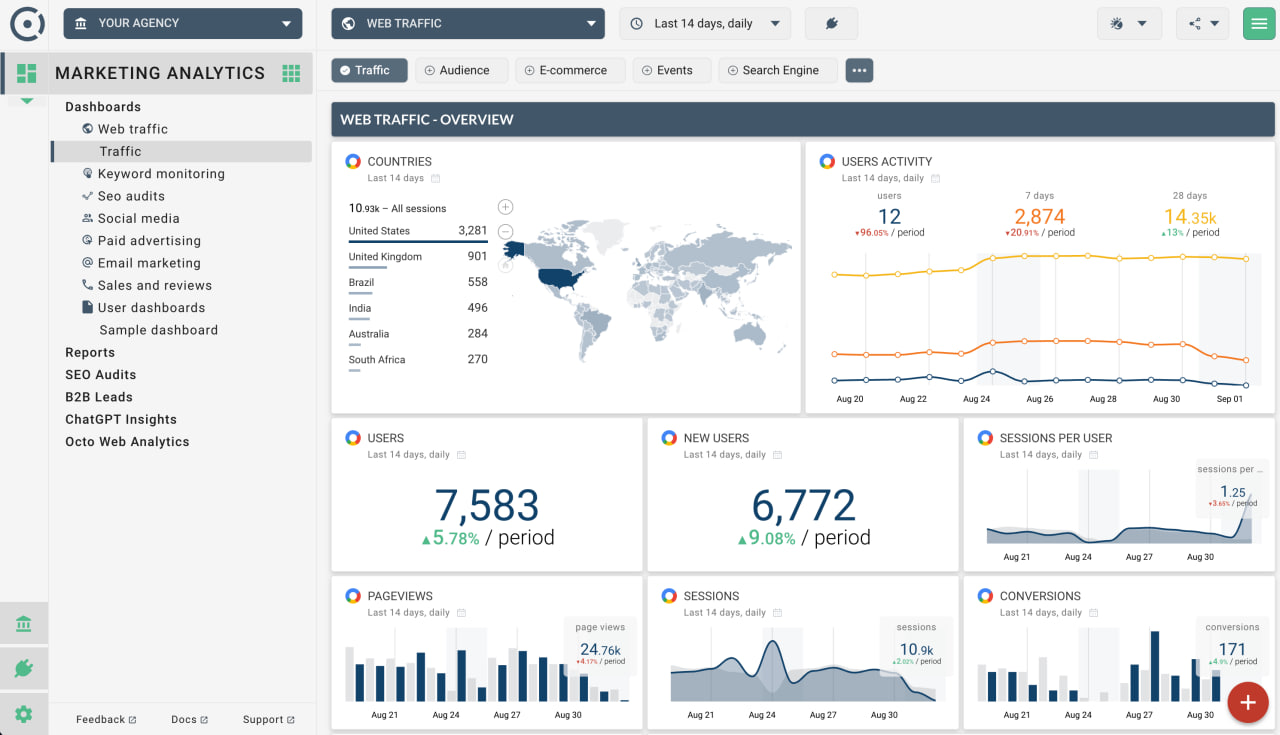
Octoboard’s marketing analytics product allows customers to integration with over 70 cloud applications including Google Analytics, Paid Advertising platforms, Ecommerce systems and much more.
CRM system integration enables tracking user journeys from initial contact to conversion. This holistic view facilitates better marketing strategy adjustments.
Creating an effective marketing report involves choosing the appropriate report type, customizing dashboards, and creating meaningful segments. Each of these steps is critical to ensuring the data is relevant and actionable.
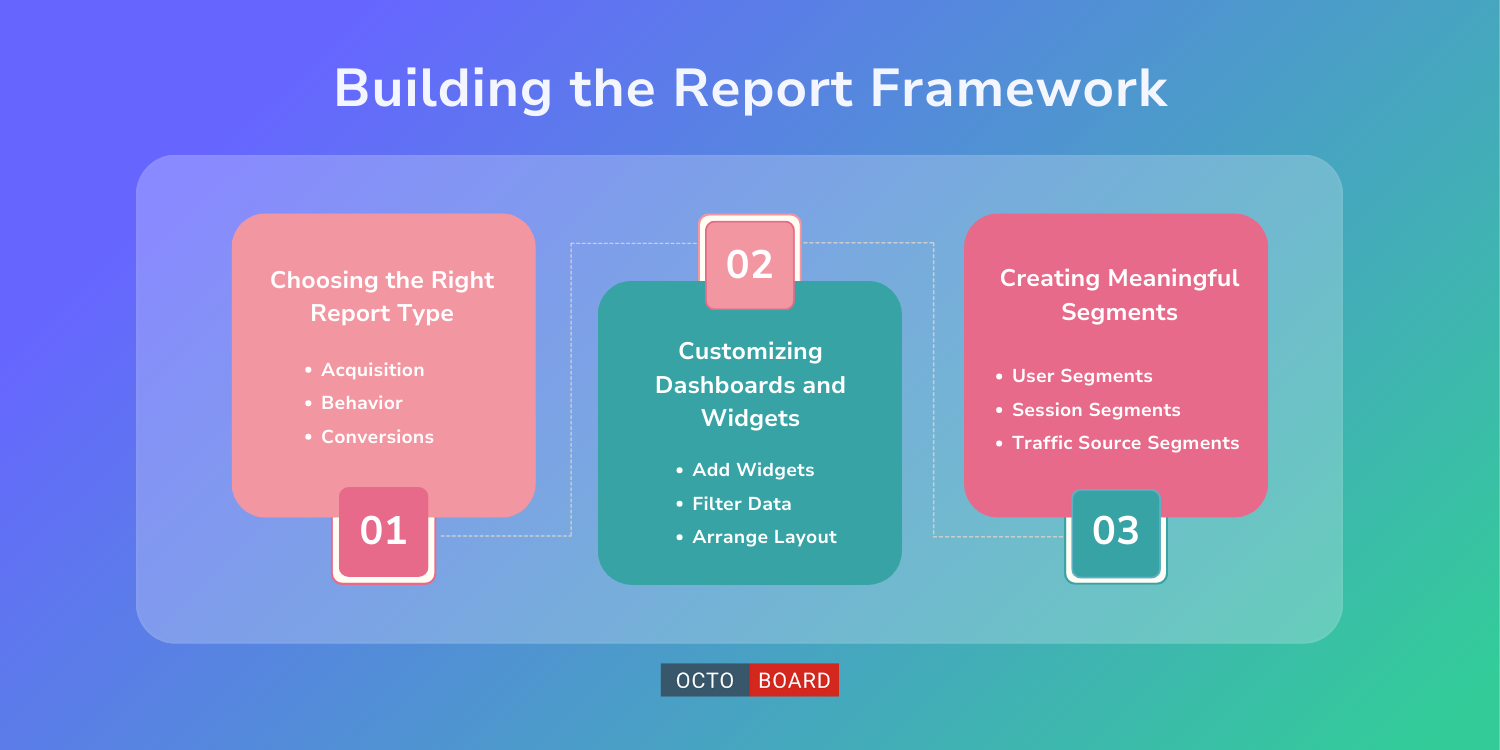
Selecting the correct report type is essential. Google Analytics offers various reports, such as Acquisition, Behavior, and Conversions. Each type focuses on different aspects of marketing performance.
- Acquisition: Tracks how visitors find your site.
- Behavior: Shows what visitors do when they are on your site.
- Conversions: Measures the success of specific goals, such as sales or sign-ups.
Choosing the right report helps in understanding user behavior and campaign effectiveness. Custom reports can also be created to fit specific business needs.
Customization of dashboards and widgets allows for a personalized view of key metrics. Google Analytics dashboards can be tailored to display only the most relevant data.
- Add Widgets: Add charts, tables, and scorecards to visualize data.
- Filter Data: Apply filters to focus on specific segments or campaigns.
- Arrange Layout: Organize the dashboard layout to highlight critical information.
A well-organized dashboard provides at-a-glance insights, aiding quick decision-making. The customization should align with business goals and key performance indicators (KPIs).
Creating segments within Google Analytics allows for the analysis of specific groups of users. Segmentation can be based on various criteria such as demographics, behavior, or traffic source.
- User Segments: Focus on characteristics like age, gender, or interests.
- Session Segments: Analyze behavior during specific visits.
- Traffic Source Segments: Examine traffic from different origins like social media, email, or organic search.
Segments help to uncover trends and patterns that may be hidden in the aggregate data. Targeted analysis enables more effective marketing strategies and campaign adjustments.
Accurate audience insights are critical for tailoring marketing strategies effectively. By examining demographics, user behavior, acquisition channels, and user flow, businesses can better understand their audience's needs and preferences.
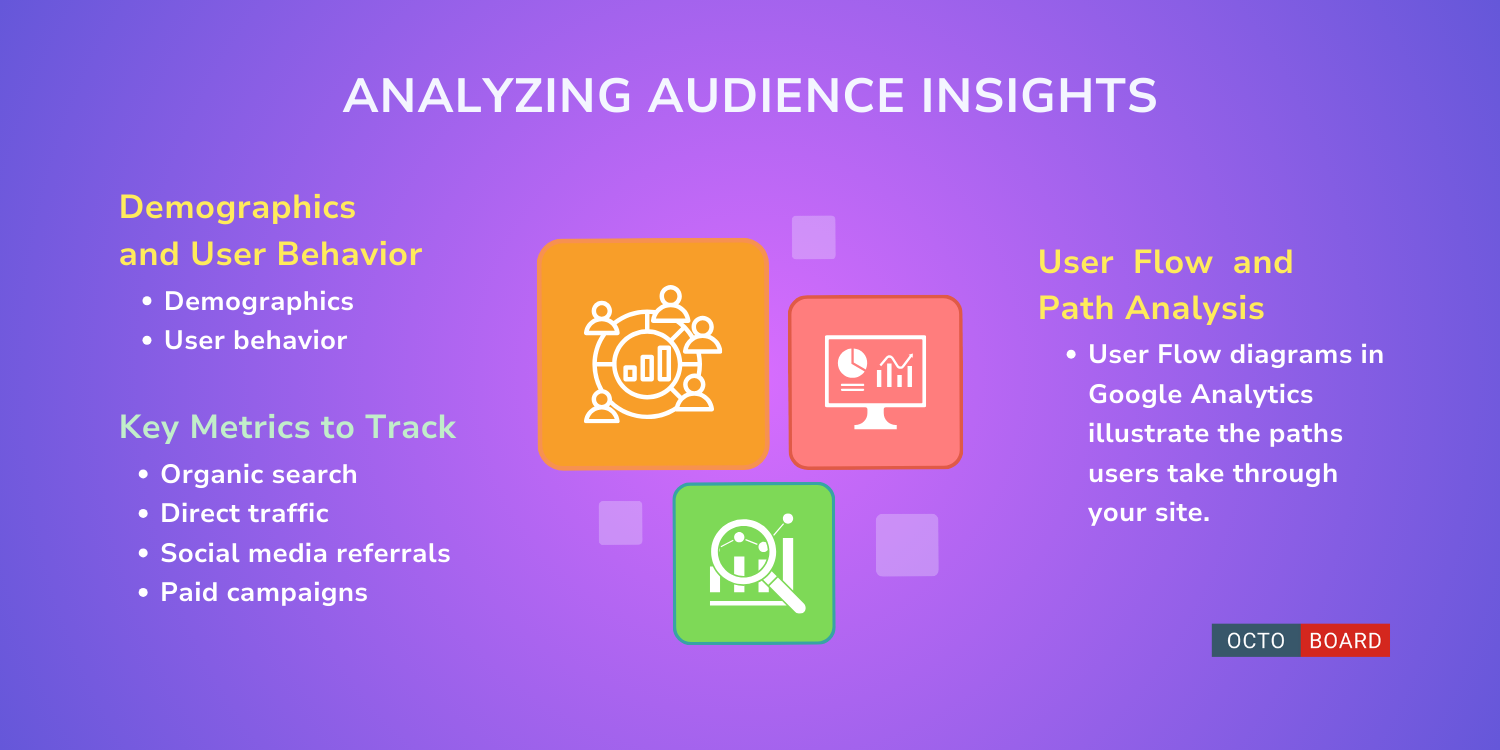
To understand who is engaging with your content, look at demographics such as age, gender, and interests. Google Analytics provides detailed reports showing user distribution across these categories.
Marketers should pay attention to high-traffic age groups and tailor content to their preferences. User behavior metrics like session duration and pages per session offer insights into how engaging your content is. High engagement often translates to a higher likelihood of conversions.
By analyzing acquisition channels, businesses can pinpoint the origins of their site traffic, such as organic search, direct traffic, social media referrals, and paid campaigns.
Each channel's performance should be evaluated to understand which drives the most valuable traffic. Metrics like bounce rate, average session duration, and conversion rate are essential to determine the effectiveness of each channel.
User Flow diagrams in Google Analytics illustrate the paths users take through your site. Identifying primary entry pages and exit points helps optimize user experience and improve conversion rates.
Path analysis allows you to understand the common routes users take to complete tasks, like making a purchase or filling out a form. Adjusting navigation and content structure based on these insights can enhance overall site performance.
For effective campaign performance evaluation using Google Analytics, it's crucial to monitor real-time data, use attribution models for deep analysis, and optimize key metrics for better outcomes.
Real-time data helps track user interactions as they happen. Google Analytics offers a Real-Time Overview that displays active users, top active pages, and engagement metrics.
- Active Users: Discover how many people are interacting with your campaign.
- Top Locations: Identify where users are coming from geographically.
- Traffic Sources: Check whether users arrive via social media, direct, referral, or organic search.

This real-time insight allows immediate action, such as adjusting marketing messages or handling sudden traffic spikes. Utilizing the Real-Time Events report can help track specific interactions like link clicks or form submissions relevant to the campaign.
Attribution models determine how credit for conversions is allocated across various touchpoints in the customer journey. Google Analytics' Attribution Tool includes several models:
- Last Interaction: Gives all credit to the final touchpoint before conversion.
- First Interaction: Credits the initial touchpoint.
- Linear: Distributes credit evenly across all touchpoints.
Choosing the right attribution model aids in understanding which marketing efforts drive conversions. Google Analytics also offers Custom Attribution Models to tailor weightage according to the campaign's unique characteristics.
Optimization involves analyzing data to enhance campaign performance. Start by examining Conversion Rate and Bounce Rate to identify areas for improvement. Implement A/B testing using Google Analytics' Experiments Tool to test variations of landing pages or messages.
- Conversion Rate: Percentage of visitors who complete a desired action.
- Bounce Rate: Percentage of visitors who leave after viewing only one page.
Advanced segments can isolate specific user groups, making it easier to target high-value customers. Leveraging Audience Reports provides demographic and interest data, enabling personalized marketing strategies that resonate more effectively with target segments.
Engagement metrics like bounce rate and content performance can offer valuable insights into user behavior and the effectiveness of marketing efforts. These measurements help in refining strategies and improving overall user experience.
Landing pages are the first interaction point for users. The bounce rate indicates the percentage of visitors who leave the site after viewing only one page. A high bounce rate may suggest that the landing page is not engaging or relevant.
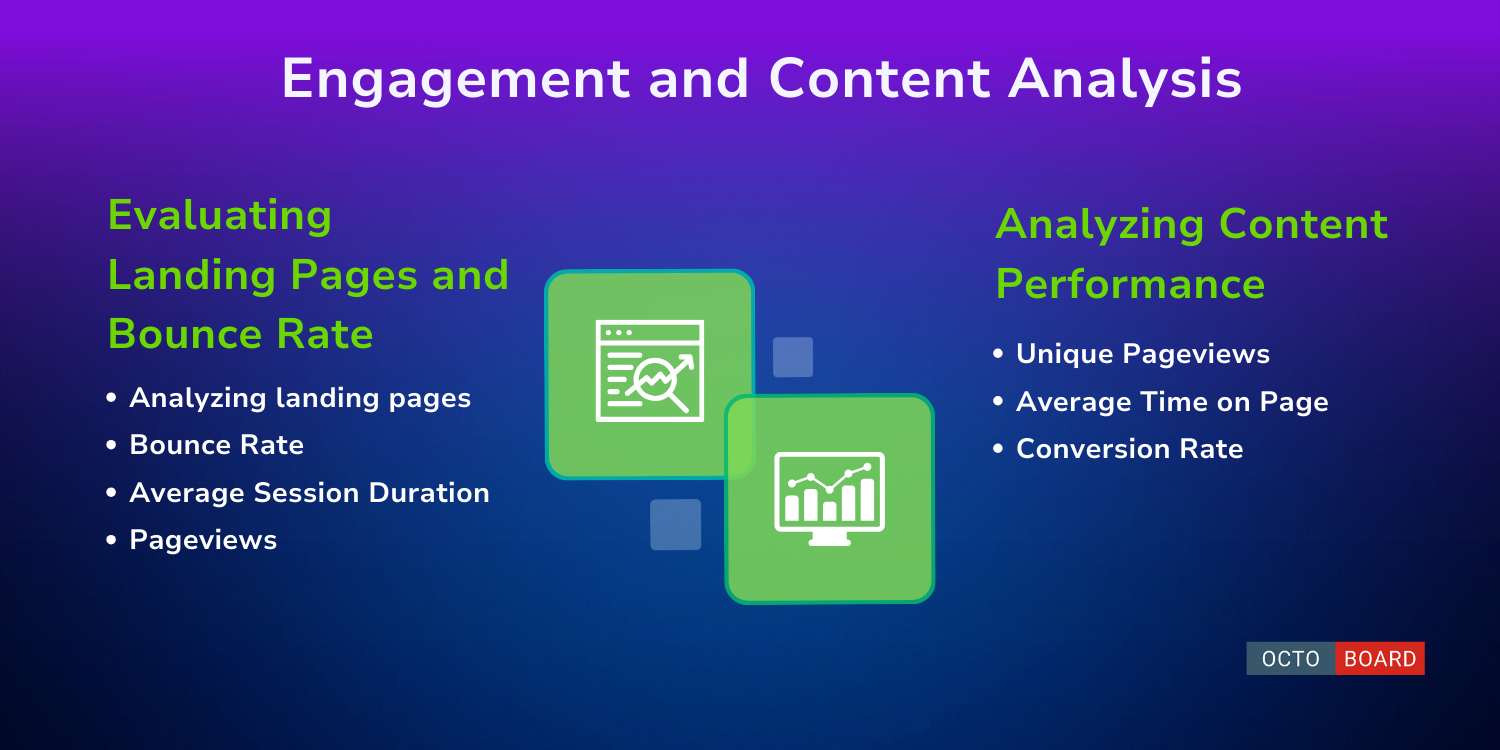
Analyzing landing pages helps identify which pages capture visitors' interest and which don't. Marketers can utilize this data to adjust content, layout, and calls to action.
- Bounce Rate: Highlighting problem areas.
- Average Session Duration: Time spent on pages.
- Pageviews: Identifying popular content.
By focusing on these metrics, marketers can refine their pages to better align with user expectations and business goals.
Content performance analysis involves measuring how well different pieces of content attract and retain users. This can include blog posts, videos, and other media. Using Google Analytics, marketers can track metrics to gauge effectiveness.
Key indicators:
- Unique Pageviews: Understanding reach.
- Average Time on Page: Measuring engagement.
- Conversion Rate: Determining success in achieving goals.
Segmenting content by these metrics enables marketers to recognize what resonates most with their audience. By identifying top-performing content, strategies can be tailored to produce more high-impact pieces, enhancing user engagement and supporting marketing objectives.
Accurate conversion tracking and detailed e-commerce analytics are essential for optimizing marketing strategies and understanding customer behavior. They provide insights into user actions and overall performance.
Conversion rates indicate the percentage of website visitors who complete a desired action, such as making a purchase or signing up for a newsletter. These metrics are essential for evaluating the effectiveness of marketing campaigns and website design.
To measure conversion rates in Google Analytics, one must set up Goals. Goals can be configured for specific actions, such as filling out a form. Reviewing these metrics helps assess the impact of marketing activities and website changes.
Monitoring conversion rates helps identify successful strategies. It assists in recognizing which pages or channels convert efficiently, enabling data-driven decisions for optimization. Visual tools, such as funnels, can also illustrate user journeys and highlight drop-off points.

E-commerce analytics in Google Analytics provide insights into sales performance, product popularity, and customer behavior. Key metrics include transaction volume, average order value, and revenue. This data allows businesses to tailor their marketing efforts to improve sales.
Setting up Enhanced E-commerce in Google Analytics offers deeper insights, such as product impressions, add-to-cart actions, and checkout behavior. Analyzing these actions helps in refining product offerings and promotional strategies.
Dashboards with customizable reports can display essential e-commerce metrics, helping teams monitor performance easily. Tracking customer segments and their purchasing patterns offers opportunities for targeted marketing and improving customer retention.
To streamline the report generation process, automation can be harnessed through the Google Analytics API. Additionally, leveraging data visualization tools enhances the clarity and impact of the data presented.
Automating reports starts with the Google Analytics API, which allows users to programmatically access data. APIs enable the scheduling of regular data pulls, reducing manual effort.
Using scripting languages like Python, users can write scripts to fetch data, process it, and write results to a desired location. For example, Google Sheets can be integrated to automatically refresh data at set intervals.
This automation ensures data accuracy and consistency, and saves valuable time that can be redirected towards analysis and strategy.
Effective data visualization tools transform raw data into understandable and actionable insights. Tools like Google Data Studio, Tableau, and Power BI offer powerful functionalities.
Google Data Studio integrates seamlessly with Google Analytics, allowing the creation of interactive dashboards that auto-refresh with the latest data. It supports various visual formats such as charts, graphs, and tables.
Tableau and Power BI offer advanced visualization capabilities. They connect to multiple data sources, providing more flexibility and customization options. These tools enable users to create dynamic, interactive reports that are easy to interpret and share with stakeholders.
Advanced analysis techniques allow marketers to leverage Google Analytics for deeper insights into user behavior, multi-channel interactions, and data-driven predictions. These tools enhance how data is interpreted, leading to more informed decisions.
Enhanced E-commerce Tracking offers detailed insights into the stages of the customer journey. It tracks product impressions, clicks, and detailed transaction data.
This feature helps identify high-performing products and stages where customers drop off. Marketers can use this data to optimize product listings, promotional strategies, and checkout processes. Implementing this tracking involves modifying the Google Analytics code on the website and may require collaboration with development teams.
Advanced Segments enable marketers to isolate and analyze specific subsets of data. They can create segments based on user behavior, demographics, or traffic sources. This granularity reveals how different audiences interact with the site.
Multi-Channel Funnels show how various channels contribute to conversions. By understanding the multi-touchpoint journey, marketers can allocate budget more effectively. These tools require setting up custom segments and attribution models within Google Analytics.
Machine learning models in Google Analytics offer predictive insights and anomaly detection. These models can identify trends and forecast future behavior based on historical data. Marketers can use this to anticipate traffic spikes and adjust strategies accordingly.
Machine learning can also surface unexpected patterns that might go unnoticed. Integrating this capability involves enabling relevant features in Google Analytics and configuring the model parameters. Keeping up with machine learning advancements ensures marketers stay ahead of the curve.
Using Google Analytics data effectively can transform raw numbers into meaningful business strategies and ensure stakeholders understand key metrics.
Converting data into actionable business strategies involves identifying trends and patterns. Segmenting data by demographics or user behavior helps uncover insights. For example, high bounce rates on key pages may indicate poor user experience, guiding improvements.
Analyzing conversion paths highlights bottlenecks in the customer journey. Custom reports can focus on specific objectives like marketing campaign performance. Monitoring real-time data allows for quick adjustments to tactics.
Regularly reviewing and refining reports ensures they remain aligned with business goals. Automated reports save time and keep the team informed. Ultimately, leveraging data effectively drives informed decision-making and strategy formulation.
Communicating data clearly to stakeholders is crucial. Use visual aids such as charts and graphs for better understanding. Highlight key performance indicators (KPIs) and metrics that align with business objectives.
Simplify complex data points using infographics. Provide context around the data, explaining trends and their implications. Tailor the presentation style to the audience; executives may prefer high-level overviews, while analysts need detailed breakdowns.
Utilize dashboards for real-time, interactive overviews. Regular updates and clear narratives in presentations ensure stakeholders stay engaged and informed. Focus on actionable insights that directly impact business performance.