Marketing Analytics Reporting: Enhancing Business Insights

Marketing analytics reporting is an essential tool for businesses aiming to optimize their marketing strategies and drive growth. It involves collecting and analyzing data from various marketing channels like social media, SEO, and emails to assess their performance. By leveraging insights from marketing analytics, businesses can make informed decisions, tailor their marketing strategies, and ultimately improve their return on investment.
- Fundamentals of Marketing Analytics Reporting
- Setting Objectives for Marketing Analytics
- Data Collection and Management
- Data Sources and Integration
- Data Quality and Cleaning
- Data Storage and Accessibility
- Key Performance Indicators (KPIs)
- Selecting the Right KPIs
- Benchmarking and Performance Targets
- Tools and Software for Analytics Reporting
- Analytics Platforms Overview
- Custom Dashboards and Reports
- Automation in Reporting
- Data Analysis Techniques
- Quantitative and Qualitative Analysis
- Predictive Analytics and Modelling
- Segmentation and Cohort Analysis
- Visualizing Data for Stakeholders
- Designing Effective Charts and Graphs
- Interactive Reports and Dashboards
- Interpreting the Data
- Understanding User Behavior
- Conversion Rate Optimization
- Customer Lifetime Value Analysis
- Reporting on Marketing Campaigns
- Campaign Effectiveness
- ROI and Attribution Modelling
- Developing Actionable Insights
- Communicating Findings to Decision Makers
- Crafting the Narrative
- Presentation Skills for Analysts
Incorporating marketing analytics into regular business operations allows companies to understand their audience's demographics, preferences, and behaviors. These insights help in crafting personalized marketing campaigns that resonate with target audiences, leading to more effective campaigns. Selecting the right tools and templates for marketing analytics can streamline the reporting process, making it easier to track key performance indicators (KPIs) and metrics.

Marketing reports should combine valuable data and engaging elements such as visuals and interactive content. This not only makes reports more appealing but also easier to understand for team members. Employing a consistent branding approach, such as using specific colors, logos, and layouts, further enhances the report’s effectiveness. With efficient marketing reporting, businesses can transform data into actionable insights, fueling their growth strategy.
Marketing analytics reporting is essential for businesses to assess campaign performance, understand customer behavior, and make data-driven decisions. At the core of this process is the collection and analysis of data to provide insights into marketing strategies.
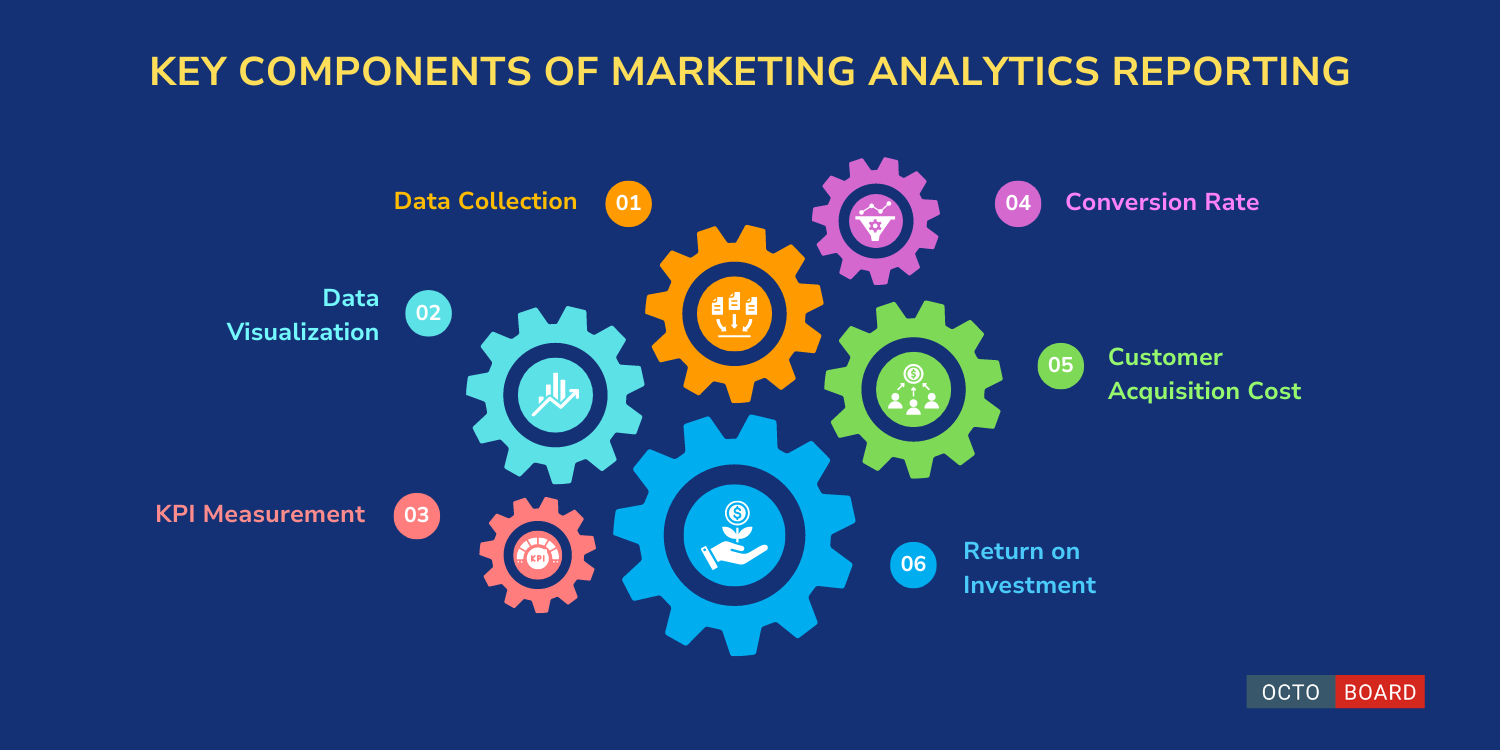
Key Components of Marketing Analytics Reporting:
- Data Collection: Utilizing tools like Google Analytics, marketers gather information on website traffic, user demographics, and campaign metrics.
- Data Visualization: The use of charts, graphs, and dashboards helps in presenting complex data in a more understandable format. Platforms such as Tableau and Excel are widely used for this purpose.
- KPI Measurement: Identifying and tracking Key Performance Indicators (KPIs) such as conversion rates, customer acquisition cost, and return on investment (ROI) is crucial. A structured table can outline these metrics:
- Conversion Rate - Percentage of visitors converting to customers
- Customer Acquisition Cost - Total cost spent to acquire a new customer
- Return on Investment - Ratio of profit to cost
Tools and Techniques:
- Google Tag Manager: Efficiently manage tracking codes to gain insights without altering website code.
- Semrush and Search Console: Analyze traffic sources, monitor organic performance, and optimize SEO strategies.
Effective reporting aligns with business goals, offering actionable insights. It is important for businesses to continually adapt their strategies based on the insights derived from these reports. Maintaining clarity and accuracy in marketing analytics reporting ensures relevant data is communicated effectively to stakeholders.
Setting clear objectives is crucial in marketing analytics. Specific, measurable, achievable, relevant, and time-bound (SMART) objectives guide the process, ensuring alignment with broader business goals. Clearly defined objectives allow teams to track progress and make data-driven decisions.
Possible objectives include increasing brand awareness, enhancing customer retention, or boosting lead generation. For instance, increasing social media engagement could involve raising likes and shares by a specific percentage.
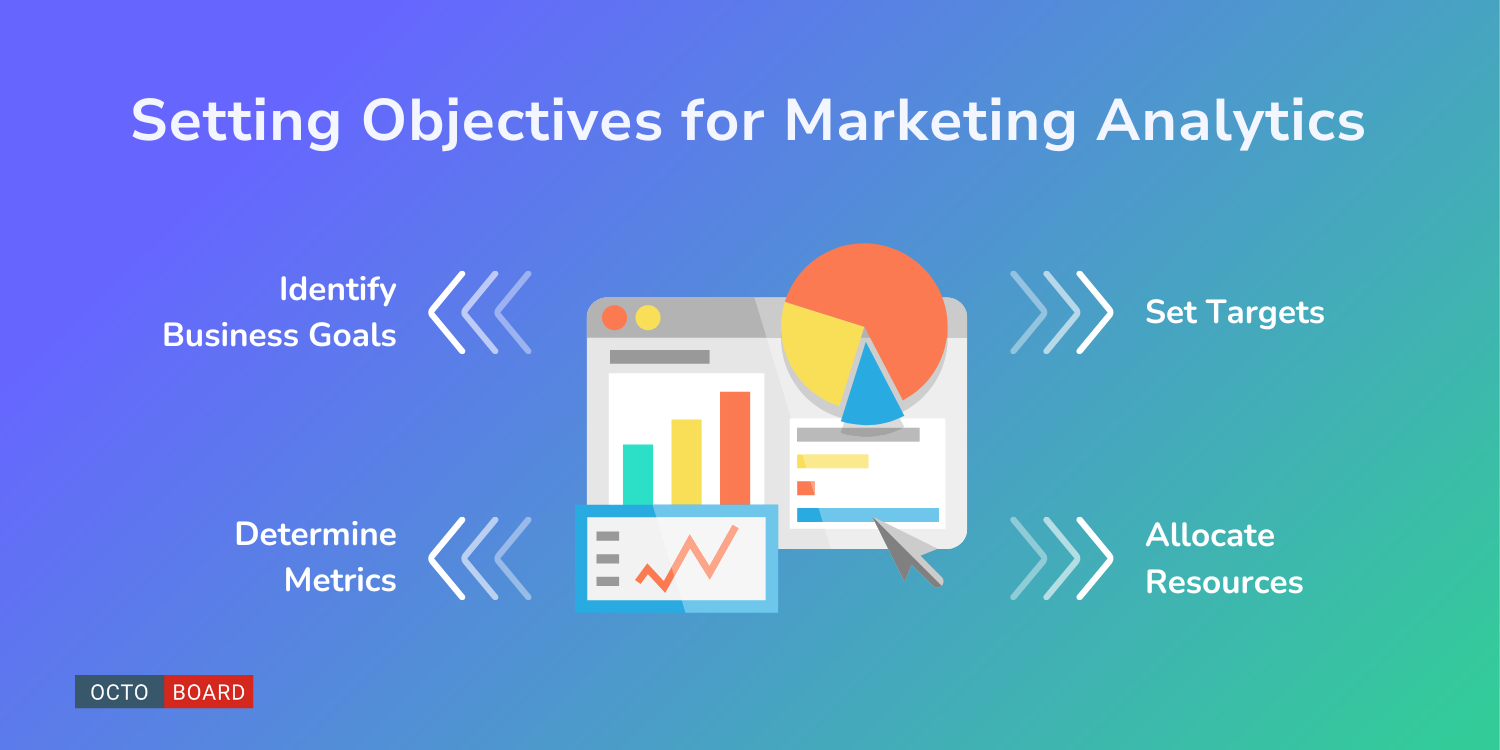
Key Steps to Setting Objectives:
- Identify Business Goals: Understanding the overarching goals of the business helps in forming relevant objectives.
- Determine Metrics: Choose metrics that accurately reflect progress toward your objectives.
- Set Targets: Establish quantitative targets that are realistic and ambitious.
- Allocate Resources: Ensure that necessary tools and personnel are available to achieve the objectives.
Effective objective setting is foundational to successful marketing analytics, laying the groundwork for strategy formulation and execution. Important considerations include selecting the right tools and monitoring emerging trends to adjust strategies when necessary.
Effective marketing analytics heavily relies on structured data collection and management. The integration of various data sources, maintaining data quality through rigorous cleaning processes, and ensuring data storage accessibility are fundamental for accurate analysis and informed decision-making.

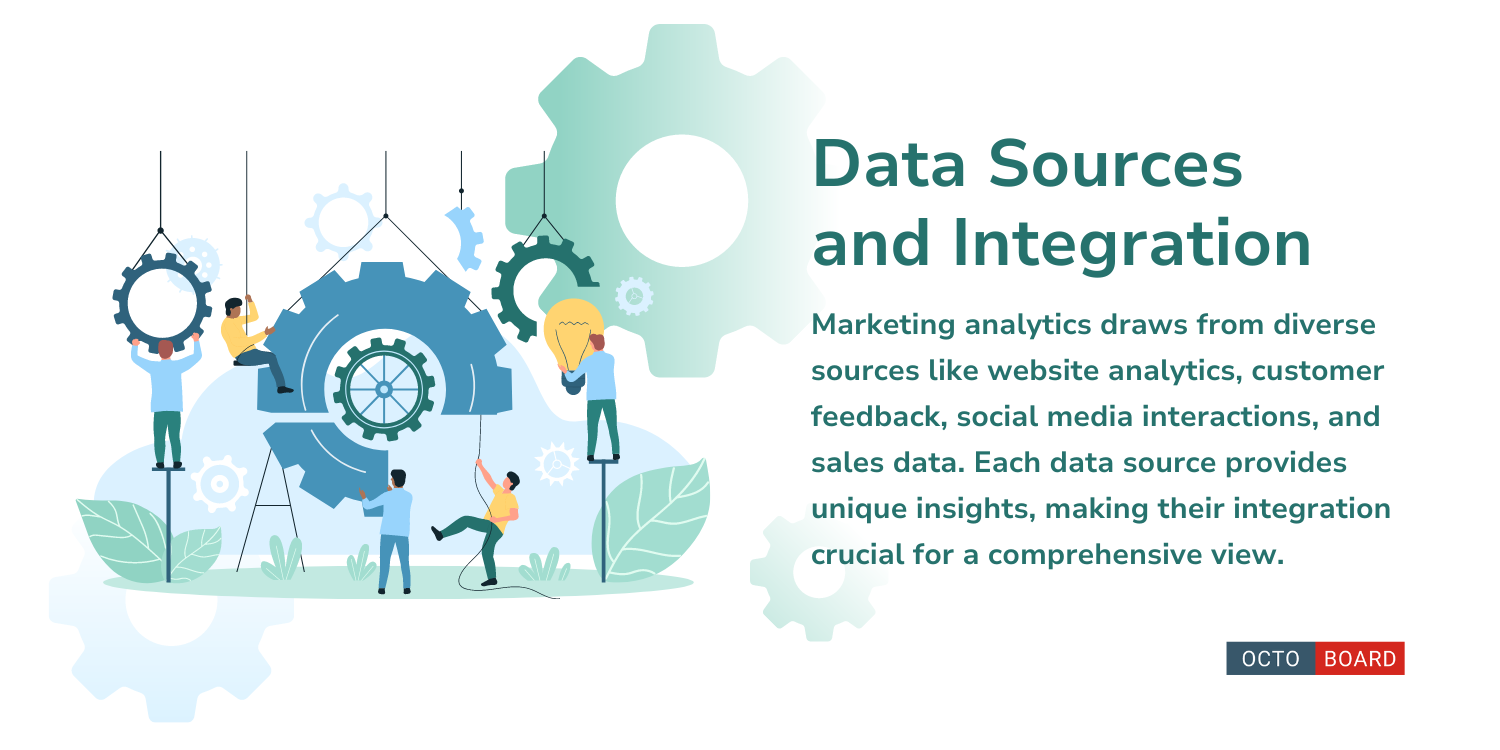
Marketing analytics draws from diverse sources like website analytics, customer feedback, social media interactions, and sales data. Each data source provides unique insights, making their integration crucial for a comprehensive view.
Integration involves combining data from these sources into a unified system. Techniques such as ETL (Extract, Transform, Load) processes and API (Application Programming Interface) use are often employed. Automation tools can streamline this process, allowing seamless data flow and real-time updates, resulting in more efficient analytics and reporting.
Data quality is vital for trustworthiness and accuracy in analytics. Poor data quality can lead to erroneous insights, affecting business strategies. Data cleaning involves detecting and correcting inaccuracies, filling missing values, and eliminating duplicates.
This ensures consistency and reliability. Regular audits and validations help maintain high data quality. Advanced software tools can automate much of the cleaning process, reducing manual errors and saving time, thus enhancing the efficacy of marketing analytics.
Storing data securely and ensuring its accessibility are key components. Cloud-based solutions are increasingly popular, providing scalable and flexible storage options. These platforms support data security through encryption and regular backups.
Accessibility refers to the availability of data to stakeholders when needed. Implementing role-based access ensures sensitive information is only available to authorized personnel. Proper storage solutions not only protect data but also enhance collaborative analytics by enabling seamless access across teams.
Key Performance Indicators (KPIs) are essential for understanding the effectiveness of marketing activities. They allow teams to align marketing efforts with business goals and evaluate success through measurable metrics.
Choosing the right KPIs depends on specific marketing objectives. Impressions measure how often content is displayed, enhancing brand visibility. Meanwhile, Return on Ad Spend (ROAS) evaluates the revenue generated from ad campaigns relative to their costs.
Conversion Rate is another important indicator, reflecting the percentage of visitors who take a desired action. It's vital for marketers to ensure KPIs align with the company's strategic goals. This alignment helps focus efforts on metrics that truly matter.
Benchmarking involves comparing KPIs against industry standards or past performance. This practice helps identify gaps and determine realistic performance targets. Companies often look at historical data to set baseline figures for their KPIs.
Performance targets need to be specific, such as aiming for a 10% increase in conversion rates over the next quarter. Regular monitoring allows marketers to make informed decisions and necessary adjustments. Having clear performance targets fosters accountability and drives continuous improvement in marketing efforts.
Marketing analytics reporting relies on a range of tools and software that assist businesses in understanding their data. These tools offer an array of features like analytics platforms, custom dashboards, and automation capabilities to streamline reporting and enhance decision-making.
Analytics platforms form the backbone of marketing reporting. Google Analytics 4 (GA4) is a widely-used tool that delves into user interaction and tracks website metrics such as traffic and engagement. HubSpot provides built-in analytics and dashboards to measure campaign performance. These platforms often offer real-time data analysis, which is crucial for making timely marketing decisions. Furthermore, tools like Improvado specialize in marketing intelligence, offering high-level analytics for medium to large-scale enterprises.
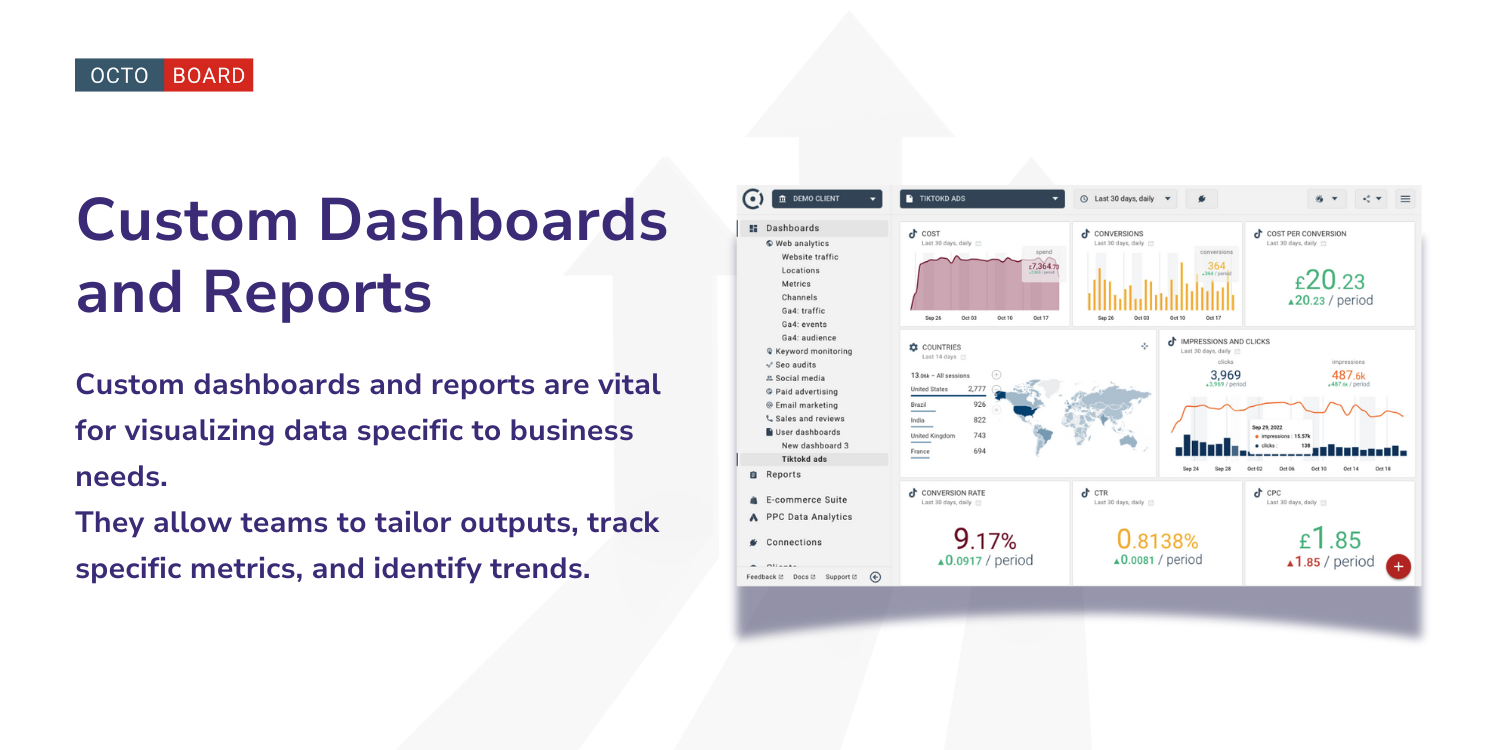
Custom dashboards and reports are vital for visualizing data specific to business needs. They allow teams to tailor outputs, track specific metrics, and identify trends. HubSpot’s dashboard software offers users the flexibility to view campaign performance in one place. With tools like Databox, users can create custom reports, pulling data from various sources to display insights clearly and efficiently. These dashboards enable companies to align marketing efforts with strategic goals by presenting data in an organized manner.
Automation in reporting saves time and resources by streamlining routine tasks. Many tools, such as Improvado, come with pre-built data pipelines that automate data collection and integration. This eliminates the need for manual data entry, allowing teams to focus on analysis and strategy. Automated reporting tools can be set up to deliver regular updates, ensuring that marketing teams remain informed with the latest data insights. As a result, businesses can enhance their agility in responding to market changes.
In marketing analytics, leveraging a variety of data analysis techniques helps in evaluating campaign performance and understanding consumer behavior. Key techniques include analyzing both quantitative and qualitative data, using predictive models, and employing segmentation strategies.
Quantitative analysis involves numerical data that marketers use to measure consumer behavior and campaign effectiveness. Techniques such as descriptive and inferential statistics provide insights into large data sets, enabling marketers to make data-driven decisions.
Qualitative analysis allows for the exploration of non-numerical data, like customer feedback, to gain a deeper understanding of consumer attitudes. Methods like content analysis can uncover patterns in text, enhancing the narrative offered by quantitative results. By combining both approaches, marketers craft comprehensive reports that present a holistic view.

Predictive analytics utilizes historical data to forecast future marketing trends and consumer behavior. Techniques like regression analysis help examine relationships between variables, providing insights into potential future outcomes. Marketers often employ machine learning models to improve prediction accuracy.
Scenario analysis can simulate different marketing strategies, assessing potential impacts. By anticipating these outcomes, companies can adjust their strategies proactively, optimizing resource allocation and improving return on investment (ROI). Predictive models, therefore, add immense value to strategic planning efforts.
Segmentation involves dividing a customer base into distinct groups based on various criteria, such as demographics or purchasing habits. This allows for tailored marketing strategies that resonate with specific segments of the audience. Through effective segmentation, marketers can improve engagement and conversion rates.
Cohort analysis examines groups of customers who share a common characteristic over a specific period. This technique is invaluable in understanding behavior shifts and lifecycle stages. By comparing cohorts, marketers identify trends and evaluate the long-term effectiveness of their strategies, ultimately enhancing retention and customer satisfaction.
Effectively visualizing marketing data ensures stakeholders grasp key insights efficiently. This involves designing clear charts and utilizing interactive dashboards to facilitate decision-making.
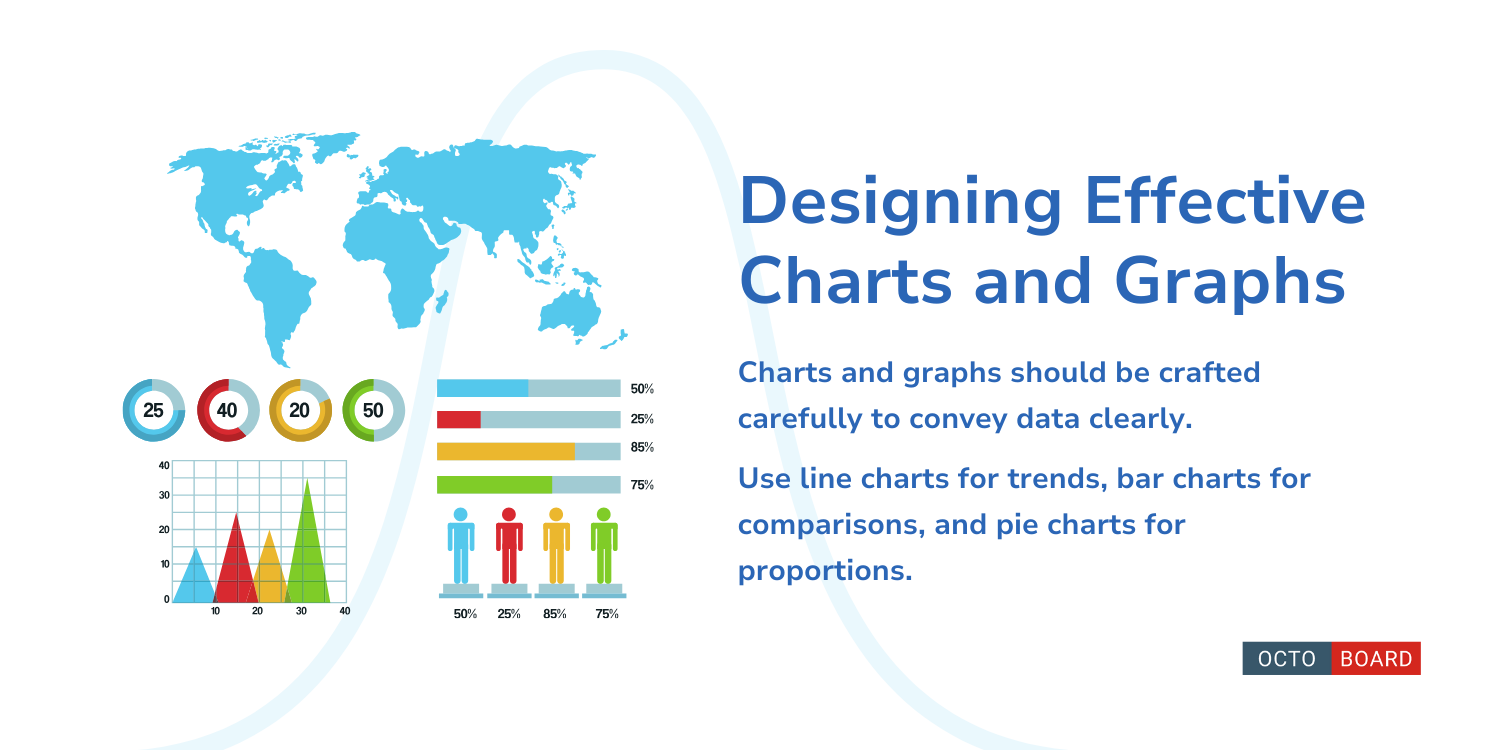
Charts and graphs should be crafted carefully to convey data clearly. Choosing the appropriate chart type is crucial: use line charts for trends, bar charts for comparisons, and pie charts for proportions.
Color and labeling enhance comprehension. Color should highlight essential data points and maintain a consistent theme across visuals. Labels should be concise but descriptive enough to provide context.
Clutter can diminish clarity. Removing unnecessary elements helps the audience focus on important information. Using a grid layout can also improve readability and organization.
Interactive dashboards engage stakeholders by allowing them to explore data dynamically. Tools like Power BI enable users to slice data by time frames, regions, or other metrics, revealing deeper insights.
These dashboards can integrate data from multiple sources. This comprehensive view aids in understanding complex datasets. Filters and dropdown menus allow users to customize their analysis effortlessly.
Real-time data updating is beneficial in fast-paced environments. It ensures stakeholders have access to the latest information. Interactive visuals often lead to more informed discussions and better strategic decisions.
Interpreting marketing data involves examining user behavior, optimizing conversion rates, and analyzing customer lifetime value. Each aspect provides actionable insights for improving marketing strategies and decision-making processes.
Understanding user behavior involves analyzing how visitors interact with a brand’s digital presence. Metrics like page views, session duration, and navigation paths reveal patterns that can help marketers improve website design and content relevance.
Tools like Google Analytics or heatmap software visualize user engagement, highlighting areas with high interaction. Identifying frequent exit pages or abandoned carts can signal areas needing attention, allowing for targeted improvements. By utilizing these insights, businesses can align their digital assets more closely with user preferences and expectations.
Conversion Rate Optimization (CRO) aims to increase the percentage of users taking desired actions, such as signing up for newsletters or purchasing products. Techniques include A/B testing, which compares two versions of a webpage to determine the more effective one.
Analyzing where users drop off in the conversion funnel helps pinpoint barriers in the process. CRO involves both statistical analysis and creative strategies, like enhancing call-to-action buttons or simplifying checkout processes. Successful implementation can lead to increased sales, improved user satisfaction, and more effective use of marketing budgets.
Customer Lifetime Value (CLV) calculates the total revenue a business can expect from a single customer account throughout its relationship. By evaluating purchasing patterns and frequency, businesses can predict CLV and strategize effectively.
Focusing on CLV helps prioritize customer retention efforts over new acquisition, enhancing loyalty programs and personalized communication. Data analytics can segment customers based on their value, allowing tailored marketing campaigns for different groups. Understanding CLV enables smarter investment in resources to maximize long-term profitability and enhance customer relationships.
Analyzing marketing campaigns involves understanding their impact on audience engagement and financial outcomes. Effective reporting provides insights into campaign effectiveness and return on investment (ROI), enhancing future strategies.
Campaign effectiveness is measured by evaluating key performance indicators (KPIs) such as click-through rates, conversion rates, and audience reach. These metrics help determine how well the campaign captivates the target audience. Using web analytics tools can track user behavior and interactions, offering valuable data on engagement levels.
Visual** data representation** through charts or tables assists in quickly identifying trends and comparing performance across several campaigns. This ensures marketing efforts align with business objectives and resonate with the intended audience. Regular updates of these metrics enable real-time adjustments to strategies, optimizing outcomes.
ROI quantifies the financial return of marketing activities relative to the cost. Calculating ROI involves comparing revenue generated to marketing expenditure. Positive ROI indicates a profitable campaign, whereas negative ROI suggests the need for strategy reevaluation.
Attribution modeling allocates credit to different touchpoints in the consumer journey, aiding marketers in understanding which interactions led to conversion. Models like last-click, first-click, and multi-touch can be utilized based on data needs and available technology. Accurate attribution assists in making informed decisions on budget allocation and resource optimization. This comprehensive financial and strategic analysis ensures alignment with overall business goals.
Developing actionable insights is critical for effective marketing analytics reporting. It involves converting raw data into meaningful information that can guide strategic decisions.
Key Steps to Develop Actionable Insights:
- Identify Objectives: Clearly define marketing goals to ensure data analysis aligns with desired outcomes.
- Gather and Analyze Data: Use tools like Looker Studio or Tableau to visualize complex data sets for easier interpretation.
- Segmentation: Break down data sets by customer demographics, behavior, or location to highlight relevant trends.
Actionable insights are characterized by their ability to inspire specific marketing tactics. They're derived through meticulous analysis and are accurate and timely.
Metrics such as conversion rates, customer lifetime value, and engagement rates are often crucial in shaping these insights.

In marketing analytics, translating data into actionable insights requires an understanding of the business context. The insights must be aligned with the company's capabilities and resources to ensure realistic and feasible implementation.
When communicating marketing analytics findings to decision makers, it's crucial to craft a compelling narrative while also honing presentation skills. These approaches ensure that complex data insights are accessible, engaging, and actionable.
Crafting a strong narrative involves turning data into a story that speaks directly to decision makers. It's about selecting the most relevant data points and structuring them in a logical sequence to highlight significant insights.
Context is key; decision makers need to understand why certain data matters. Use real-world examples and case studies to illustrate potential impacts. A comparison table or bullet lists can quickly convey differences and trends. Structuring the narrative around business objectives helps maintain focus on strategic goals.

Effective presentation skills are essential for clearly conveying findings. Analysts should focus on clarity, conciseness, and engagement. Utilizing visual aids like charts, graphs, and infographics can make complex data more digestible.
Practicing delivery is important. This includes managing pace and tone to maintain audience interest. Anticipating questions and preparing concise responses can enhance credibility. Incorporating interactive elements, such as A sessions or brief demonstrations, ensures active participation from decision makers, fostering a deeper understanding.