Marketing Reporting Tutorial: Master Effective Data Analysis Techniques


- Fundamentals of Marketing Reporting
- Purpose and Importance
- Key Metrics to Track
- Understanding Data Sources
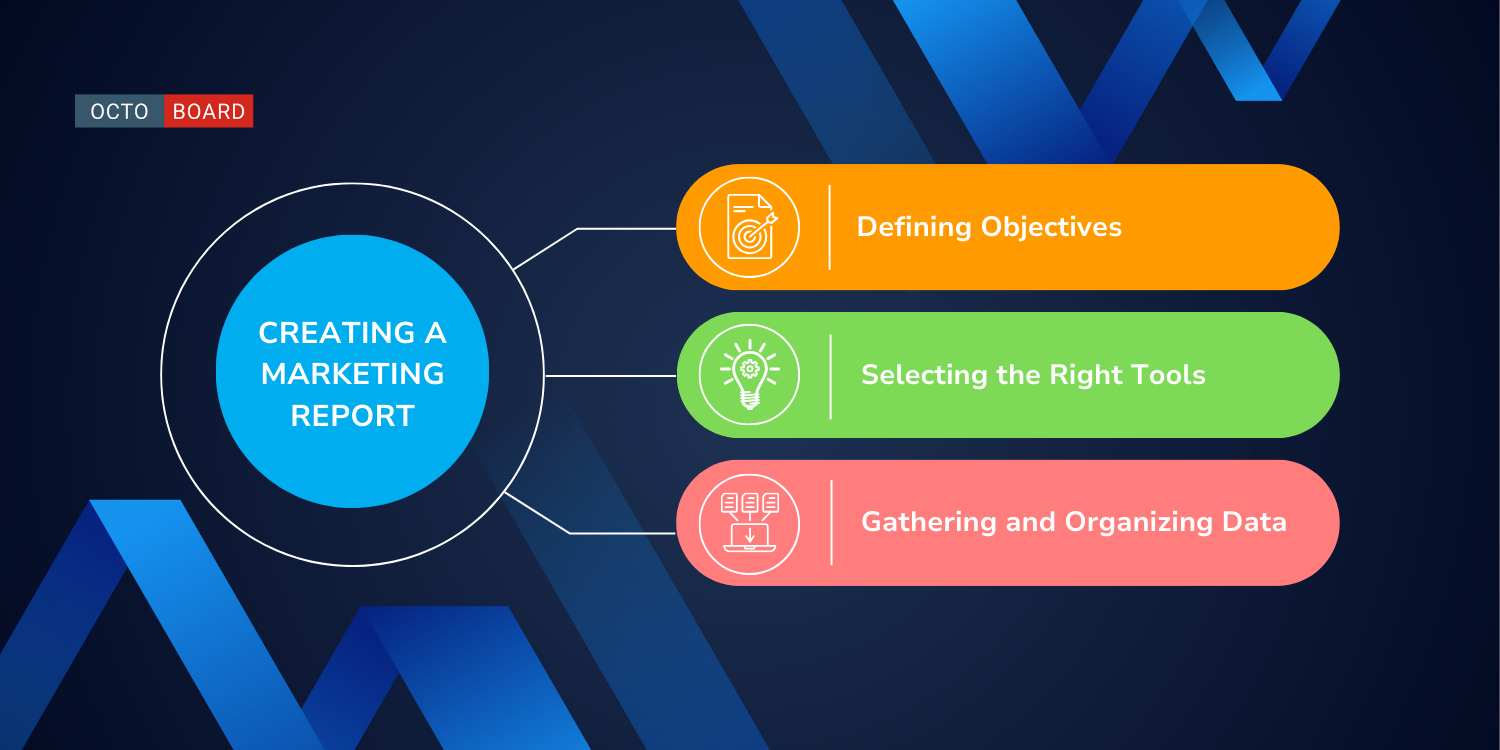
- Creating a Marketing Report
- Defining Objectives
- Selecting the Right Tools
- Gathering and Organizing Data
- Analyzing Marketing Performance
- Key Metrics:
- Segments to Consider:
- Visualizing Data for Better Insights
- Choosing Effective Charts and Graphs
- Interactive Dashboards
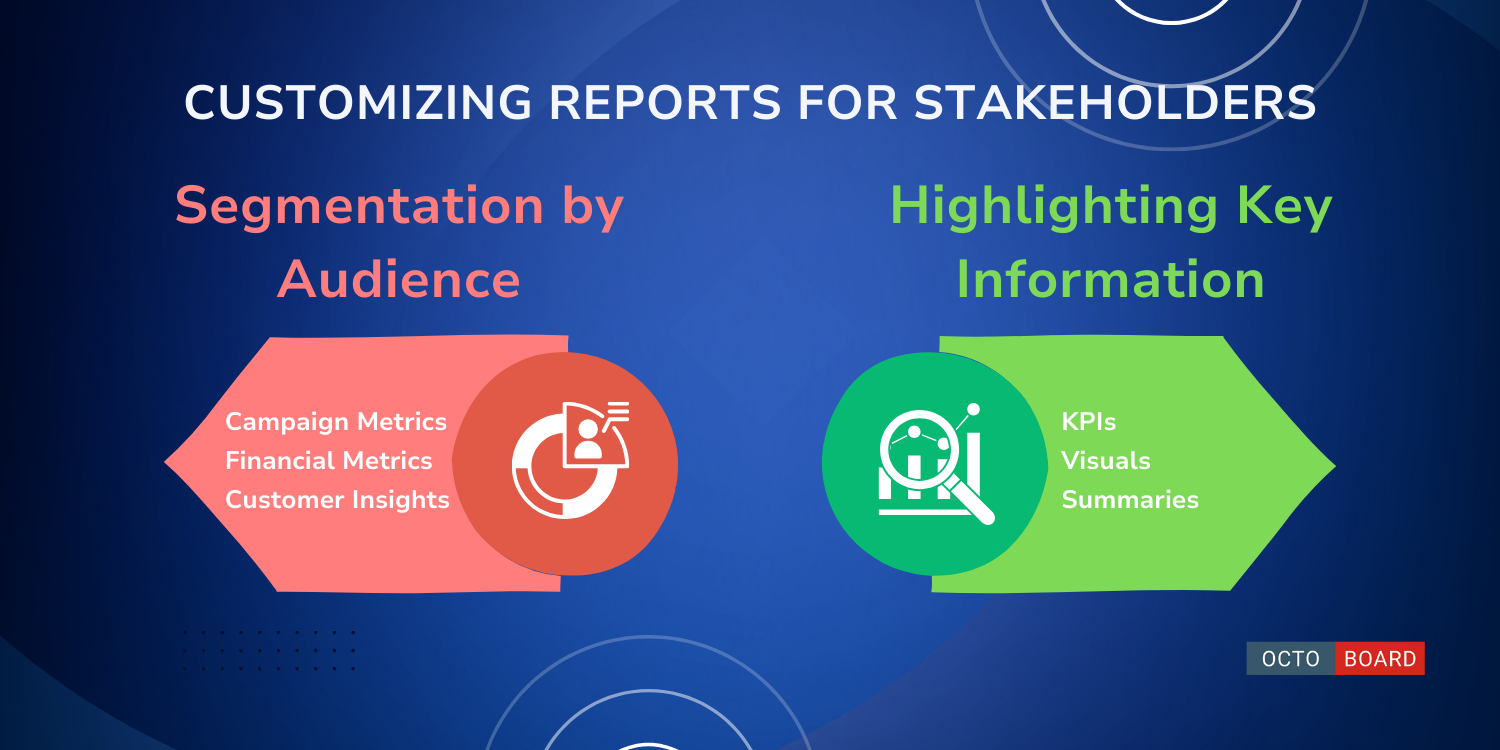
- Customizing Reports for Stakeholders
- Segmentation by Audience
- Highlighting Key Information
- Automation in Marketing Reporting
- Tools for Automated Reporting
- Setting Up Automated Workflows
- Advanced Reporting Techniques
- Predictive Analytics
- Multivariable Testing Analysis
- Common Challenges and Solutions
- Ensuring Data Accuracy
- Overcoming Analysis Paralysis
- Continual Improvement of Reporting Processes
- Frequently Asked Questions
- How can one effectively structure a marketing report?
- What essential metrics should be included in a digital marketing report?
- What are the best practices for writing a compelling marketing campaign report?
- How does one create a marketing report that highlights strategic insights?
- In what ways can marketing report templates streamline the reporting process?
- What visual elements can enhance the readability and impact of a marketing report?
Understanding marketing reporting is fundamental for anyone involved in marketing. Knowing what to track and where to find reliable data sources is key to making informed decisions.
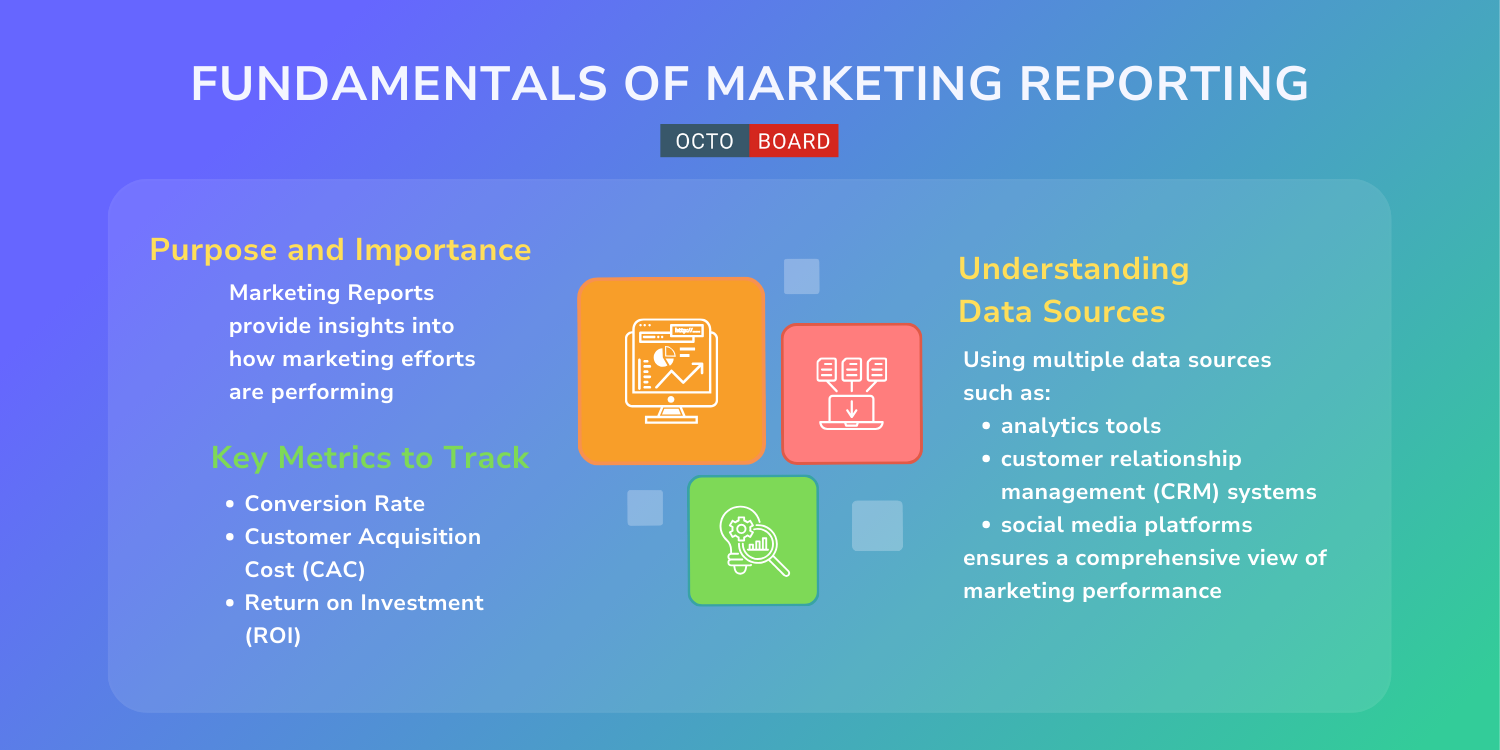
The main purpose of marketing reporting is to provide insights into how marketing efforts are performing. These reports help in evaluating the success of different campaigns and strategies. By analyzing the data, marketers can identify what works and what doesn't.
Marketing reports also play a critical role in decision-making. They offer a clear view of the return on investment (ROI), helping to allocate budgets more effectively. Without effective reporting, it's difficult to measure progress or make necessary adjustments.
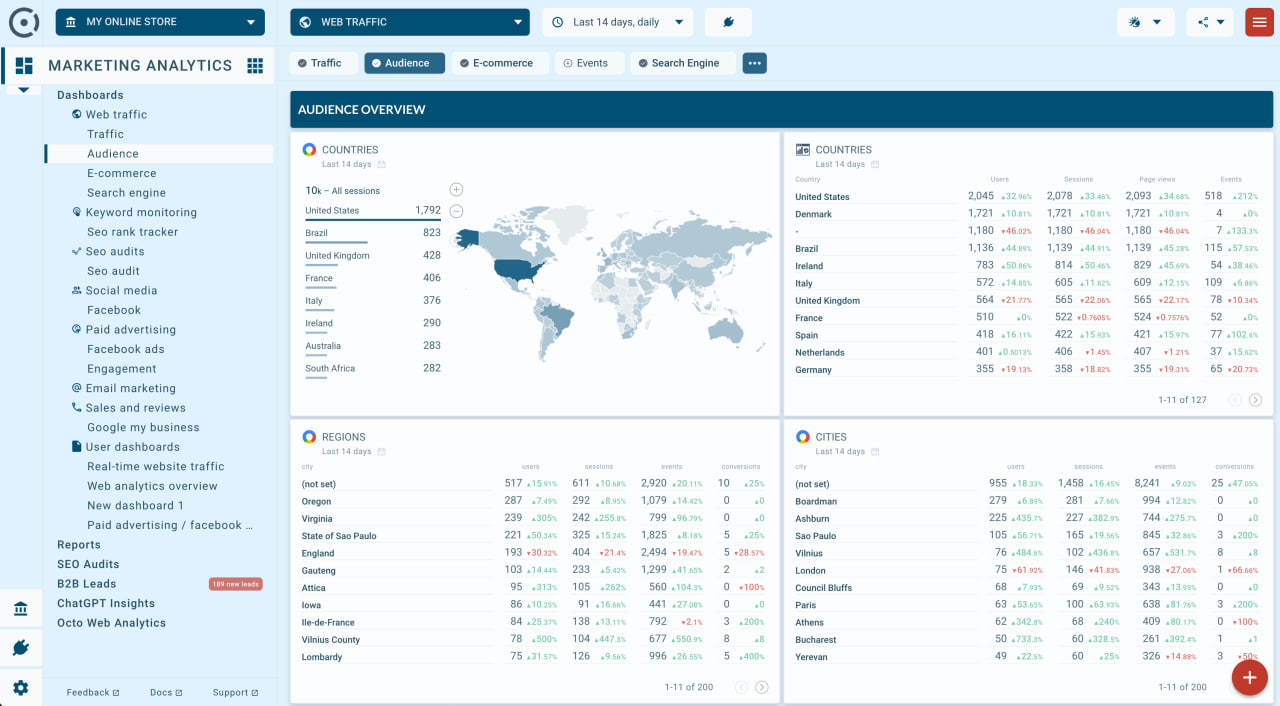
Here is an example of a quick Overview report that you can build in second using Octoboard Marketing Analytics platform.
Tracking the right metrics is essential. Some of the most important ones include:
- Conversion Rate: Measures the percentage of visitors who take a desired action.
- Customer Acquisition Cost (CAC): Calculates the cost to acquire a new customer.
- Return on Investment (ROI): Shows the overall profitability of campaigns.
- Engagement Metrics: These include likes, shares, comments, and time spent on website pages.
Each metric serves a different purpose and provides insights into various aspects of marketing performance. Regularly monitoring these metrics can highlight areas for improvement.
Data sources are where you collect the information needed for your reports. Common sources include analytics tools, customer relationship management (CRM) systems, and social media platforms.
Analytics tools like Google Analytics and Adobe Analytics provide valuable data on website traffic and user behavior. CRM systems offer insights into customer interactions and sales data. Social media platforms give engagement metrics that show how audiences are interacting with content.
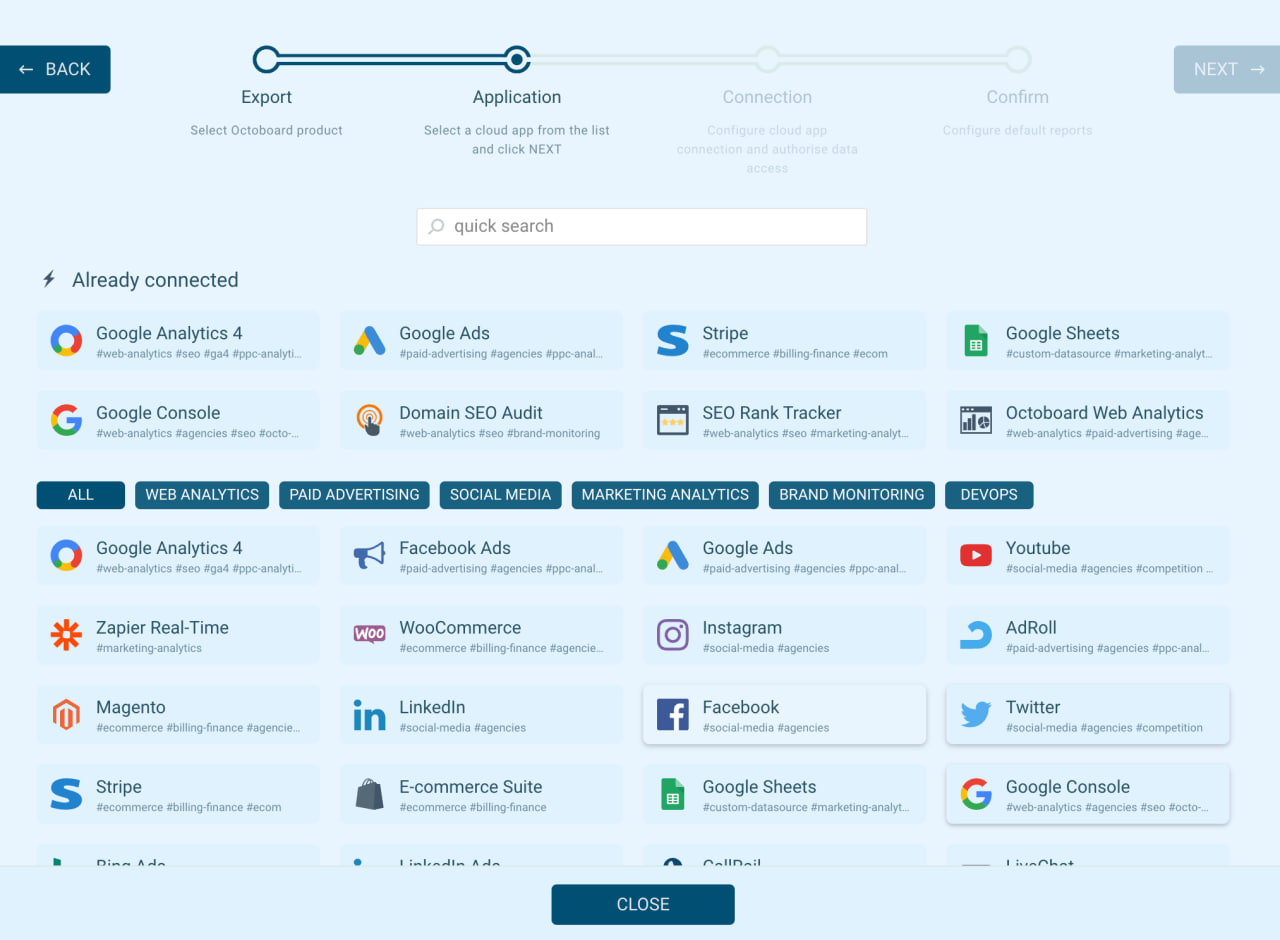
In the Octoboard platform there are over 70 standard integrations as well as own data sources such as Keywords analytics, Real-time Web Analytics Traffic and SEO audits.
Using multiple data sources ensures a comprehensive view of marketing performance. Cross-referencing data from different sources can also help in verifying the accuracy of the information collected.
Creating a marketing report involves defining clear objectives, selecting the right tools, and gathering as well as organizing relevant data. These steps are crucial for understanding the performance and making informed decisions.
Clear objectives set the direction for the marketing report. Goals can include increasing brand awareness, generating leads, or improving customer retention. Objectives should be specific, measurable, achievable, relevant, and time-bound (SMART).
For example, if a goal is to increase social media engagement, the objective might be to boost likes and shares by 20% in three months. Having these defined helps track progress and make data-driven decisions.
Without clear objectives, it's hard to determine if marketing efforts are successful. Always start with strong objectives.

Choosing the right tools enhances the effectiveness of the marketing report. There are many options, each with special features. Google Analytics helps track website traffic. Hootsuite manages social media metrics. HubSpot integrates various marketing channels.
Selecting the right mix of tools depends on the objectives. For example, use Google Analytics for web traffic and Mailchimp for email marketing. Features like dashboards, automated reports, and data visualization make tools invaluable.
Using tools effectively ensures accurate data collection and insightful reporting. These tools streamline data gathering, making the process simpler and more efficient.
Data is gathered from various sources like social media, email campaigns, and website analytics. Accurate and organized data helps in making sense of performance trends. Break down the data into categories such as demographics, behavior, and conversion rates.
Tools like Excel or Google Sheets can be used to organize data. Charts and graphs help visualize key metrics. It's important to clean the data to remove duplicates or errors, ensuring accuracy.
After organizing, analyze the data to identify trends and insights. This aids in understanding what's working and what needs improvement. Proper organization enhances clarity and supports informed marketing decisions.
To analyze marketing performance, start with key metrics like engagement rates, click-through rates (CTR), and conversion rates. These metrics provide insight into how well campaigns are performing.
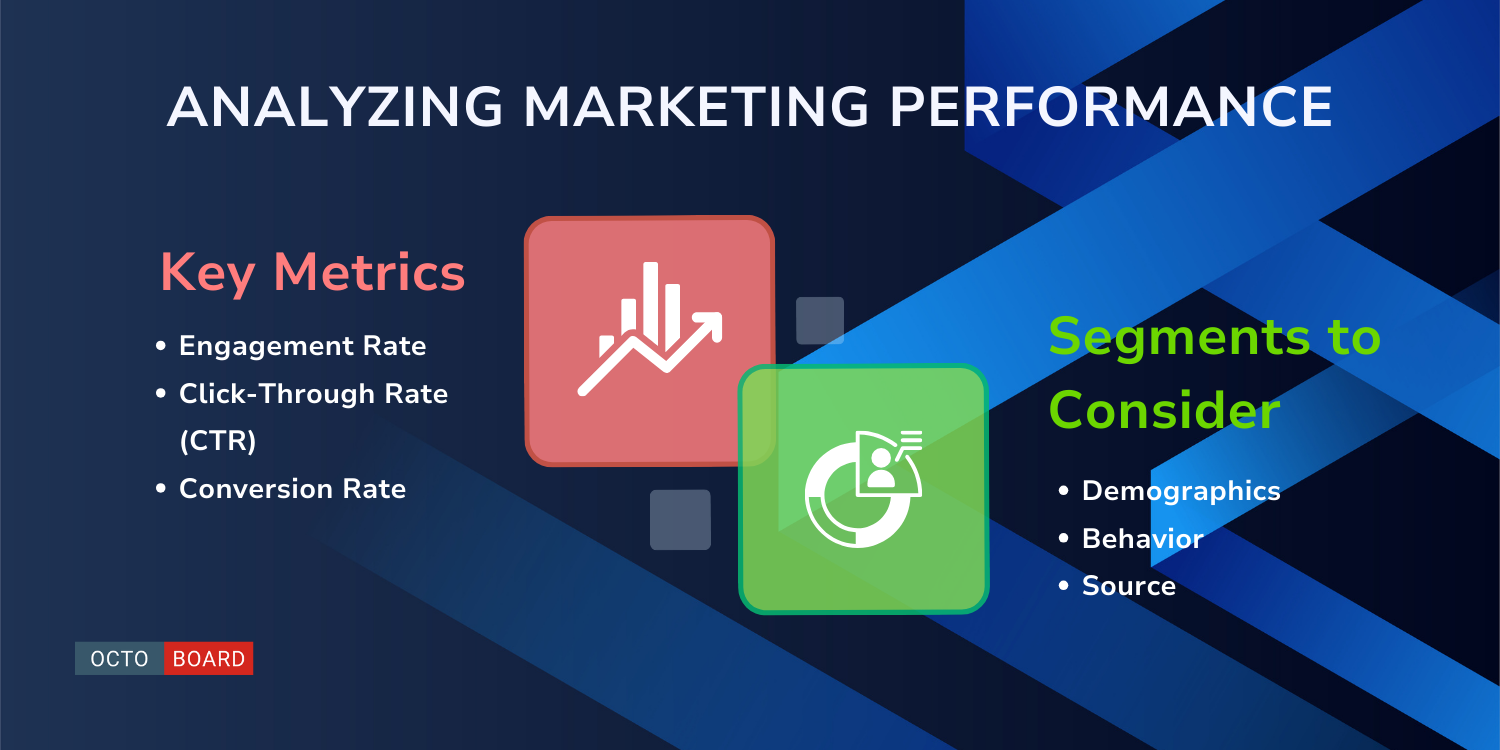
- Engagement Rate: Measures interactions with content.
- Click-Through Rate (CTR): Percentage of users who clicked on a link.
- Conversion Rate: Percentage of users who completed a desired action.
Tools like Google Analytics, HubSpot, and Tableau are essential for gathering and visualizing data. These tools help marketers understand trends and make informed decisions.

- Demographics: Age, gender, location.
- Behavior: New vs. returning users, purchase history.
- Source: Organic, paid, social media.
Regular Cross-platform PPC Ads reports helps understand what works best. Test different elements like headlines, images, and call-to-action buttons to see what drives better engagement.
Tracking Return on Investment (ROI) is crucial. ROI helps determine the profitability of campaigns. Calculate ROI using the formula:
Analyzing customer feedback through surveys and reviews provides qualitative data. Feedback helps improve future marketing strategies.
Incorporating these methods ensures a well-rounded analysis of marketing performance.
Visualizing data helps to understand trends and patterns that may not be obvious in raw numbers. It's important to choose the right type of chart or graph and to utilize interactive dashboards for clearer insights.

Choosing the right chart or graph is crucial for clear data visualization. Bar charts are great for comparing quantities side-by-side, like monthly sales figures. Line graphs show trends over time, making them ideal for tracking changes, such as website traffic throughout the year.
Pie charts work well for showing parts of a whole, such as market share distribution. Scatter plots help identify relationships between variables, useful for understanding the correlation between advertising spend and sales. Be sure to avoid clutter and choose colors that enhance readability.
Interactive dashboards make data exploration easier. Users can filter and drill down into specific data points to uncover detailed insights. These dashboards often include multiple visualizations that update in real-time, displaying the most current data.
Using tools like Tableau, Power BI, or Google Data Studio allows for creating dashboards with drag-and-drop features. Customizable widgets, such as sliders and checkboxes, let users manipulate the data dynamically. This functionality not only saves time but also provides a clearer, more immediate understanding of complex data sets.
Customizing reports for stakeholders ensures that each report addresses the specific needs of its audience and highlights the most important information.
Different stakeholders have different interests. It's crucial to tailor reports according to their needs. For instance, marketing managers might want data on campaign performance, while executives may need a broad overview of the return on investment (ROI).
Segmenting the audience helps in presenting relevant data. Organize the report to include sections like:
- Campaign Metrics: For marketing teams to examine engagement.
- Financial Metrics: For executives to focus on ROI and budget.
- Customer Insights: For product teams to understand user behavior.
Using these segments ensures that stakeholders can quickly access the information they find most valuable.
Including too many details can overwhelm the reader. Identify and highlight key information to make reports more effective. This might include:
- KPIs (Key Performance Indicators): These are essential metrics that show progress towards goals.
- Visuals: Use graphs, charts, and tables to make data easier to digest.
- Summaries: Brief summaries at the beginning of sections to highlight main points.
Highlight important numbers and trends. For example, if a campaign led to a 20% increase in leads, this should be clearly stated and possibly bolded. This ensures that the most critical information stands out to the reader.
Automation makes marketing reporting faster and more efficient. Key elements include selecting the right tools and setting up workflows.
Various tools can automate marketing reports. Popular options include Google Data Studio, HubSpot, and Tableau. These tools pull data from multiple sources and present it in easy-to-read dashboards.
Google Data Studio is free and integrates well with Google Analytics and other Google services. HubSpot offers built-in automation features for email, social media, and CRM reports. Tableau is a powerful tool for visualizing complex data but may require more technical knowledge.
Choosing the right tool depends on your specific needs, budget, and technical skills. Look for features that support your key metrics and data sources. It’s important to test a few options to see which one fits best.
Setting up automated workflows involves defining data sources, selecting metrics, and creating schedules for report generation.
First, identify which data sources you need to track. These might include Google Analytics, social media platforms, or email marketing tools. Next, choose the metrics that matter most to your business, like conversion rates, click-through rates, or return on investment (ROI).
Once data sources and metrics are defined, scheduling comes next. Many tools allow you to set up daily, weekly, or monthly reports. Automation ensures that reports are generated without manual intervention, saving time.
Test the workflows to ensure data accuracy. Regular reviews guarantee that the reports stay relevant and up-to-date.
Advanced reporting techniques can help businesses make better decisions. Two important methods are predictive analytics and multivariable testing analysis.
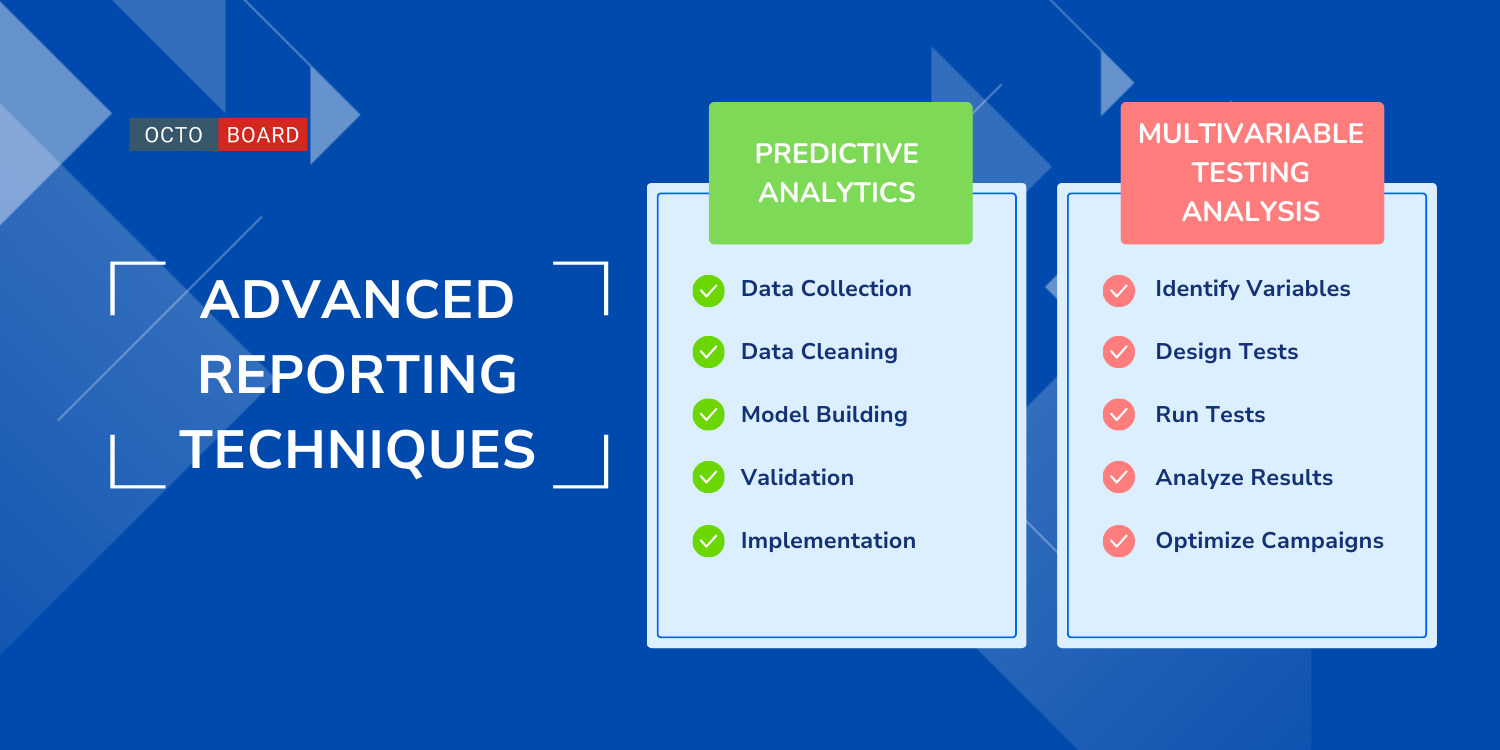
Predictive analytics uses data to forecast future trends. By analyzing past behaviors, companies can predict future outcomes. For example, sales trends can be predicted by examining purchase history and seasonal data.
Key Steps:
- Data Collection: Gather historical data from various sources.
- Data Cleaning: Remove errors and inconsistencies.
- Model Building: Use statistical models to analyze data.
- Validation: Test the model’s accuracy with new data.
- Implementation: Apply the insights to decision-making.
Multivariable testing examines the impact of multiple variables on a result. This technique is especially useful in marketing to test different campaign elements at once.
Key Steps:
- Identify Variables: Determine which elements to test (e.g., ad copy, images, CTA).
- Design Tests: Create different versions with varying variables.
- Run Tests: Implement the tests and collect data.
- Analyze Results: Determine which combinations work best.
- Optimize Campaigns: Apply these insights to improve marketing efforts.
Using these advanced techniques can greatly enhance a company’s ability to make informed decisions and optimize their marketing strategies.
Marketers often face issues like keeping data accurate and dealing with too many data choices. These problems can make reporting difficult and less useful.
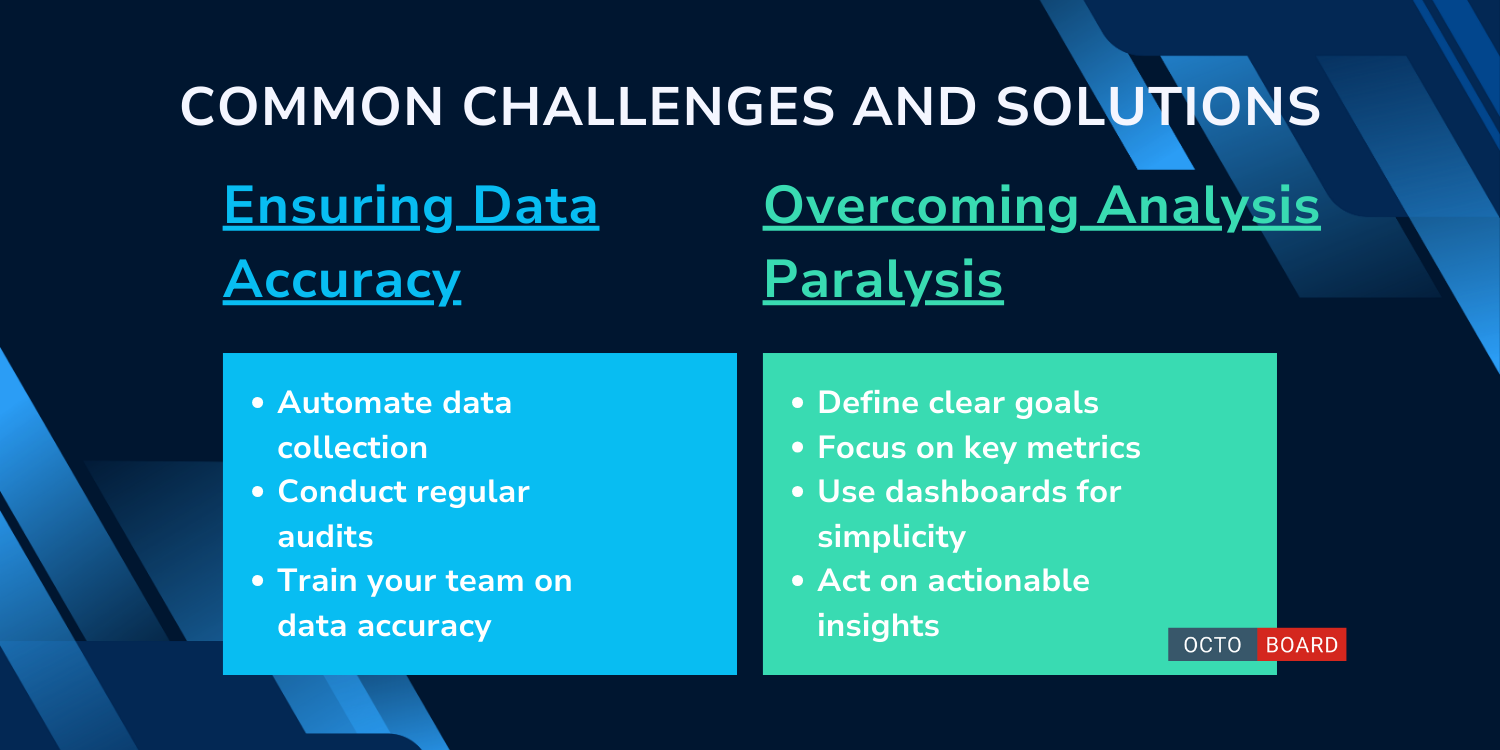
Data accuracy is crucial in marketing reports. Incorrect data can lead to wrong decisions and wasted resources. To keep data accurate, start by using reliable data sources. Always double-check the data before using it in reports.
Using automated tools can help reduce errors by collecting and processing data consistently. Regular audits are also important. They help spot mistakes early and correct them. Train your team to understand the importance of data accuracy and proper data handling practices.
Pro Tips:
- Use trusted data sources.
- Automate data collection.
- Conduct regular audits.
- Train your team on data accuracy.
Analysis paralysis happens when marketers have too much data and can't make decisions. This is common with large datasets that overwhelm the team.
To overcome this, set clear goals before diving into data analysis. Identify which metrics are most important for these goals. Tools like dashboards can help by displaying key metrics in a simple way. Keeping the focus on actionable insights reduces the chances of getting stuck in endless analysis.
Pro Tips:
- Define clear goals.
- Focus on key metrics.
- Use dashboards for simplicity.
- Act on actionable insights.
To keep marketing reports accurate, it is crucial to continually improve reporting processes.
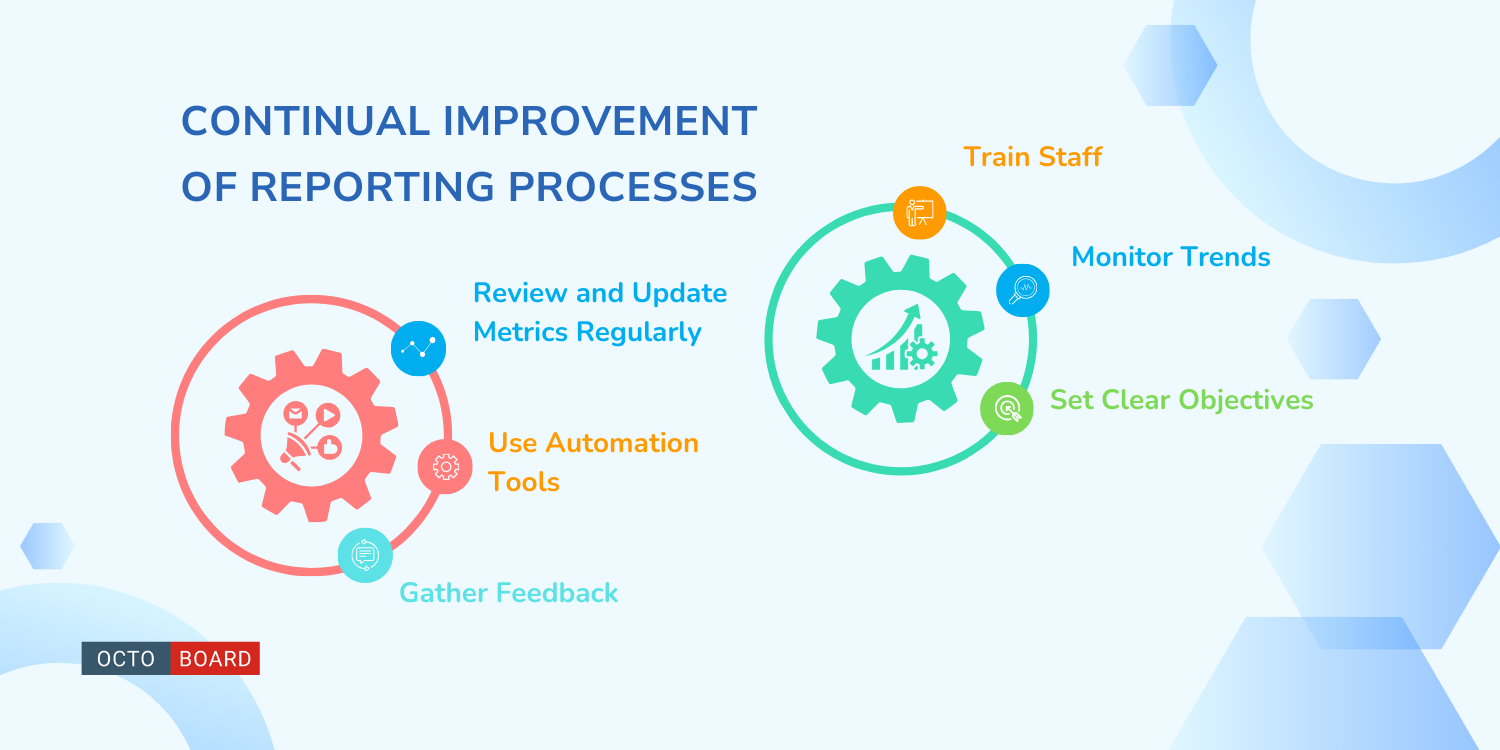
Review and Update Metrics Regularly
Marketing goals can change. Regular reviews ensure that the right metrics are being tracked. This might mean adding new metrics or removing old ones no longer relevant.
Automation tools save time and reduce errors. Tools like Google Data Studio or Tableau help to automate data collection. Look for tools that can integrate with existing data sources.
Gather Feedback
Feedback from team members is valuable. It helps identify areas for improvement. Regular feedback sessions can uncover issues that might not be obvious otherwise.
Train Staff
Training staff ensures they are up-to-date with the latest tools and practices. Regular workshops or training sessions can be beneficial.
Monitor Trends
Staying updated with industry trends is important. This helps in adapting to new methods or tools that can improve reporting processes.
Set Clear Objectives
Clear objectives help in aligning reporting efforts with marketing goals. Ensure that everyone understands these objectives.
Evaluate and Adjust
Regular evaluation of reporting processes is essential. Based on the evaluation, make necessary adjustments to improve accuracy and efficiency.
Learn the best ways to organize marketing reports, the key metrics to include, and tips for making your reports visually appealing and strategic.
Organize the report into clear sections: introduction, objectives, methodology, results, analysis, and recommendations. Use headings and subheadings to break down information. Ensure a logical flow from data collection to insights.
Include metrics such as website traffic, conversion rates, engagement rates, click-through rates (CTR), and return on investment (ROI). These provide a comprehensive view of digital performance.
Use clear, concise language. Focus on goals and achievements. Include data visuals like charts and graphs. Provide actionable insights and recommendations.
Go beyond numbers. Interpret the data to show trends and patterns. Connect the insights to broader business objectives. Offer recommendations based on the findings.
Templates save time and ensure consistency. They provide a ready-made structure that can be easily updated with new data. Many templates also include placeholders for key metrics and visual elements.
Use charts, graphs, and infographics to visualize data. Highlight key figures and trends with color and icons. Make sure visual elements are clear and easy to understand.