OCTOBOARD
English
PRICING
RESOURCES
LOGIN
TRIAL
TRIAL
English

Automated Facebook Social Media Reporting Tool for Marketing Teams and Clients

Build automated social media reports for your marketing teams and clients using Facebook data.

Automate Facebook reports and dashboards
Connect Facebook data and create automated reports and dashboards
Automated marketing reports
Business features include
 
Automated Facebook reporting
Automated reporting
Keyword rank tracker
Send data to Google Sheets
B2B lead generation
White label client portal
Send data to BigQuery
ChatGPT data insights

FACEBOOK REPORTING

Social Media analytics for Facebook - user engagement and trends within one online dashboard.

Octoboard data dashboard: Facebook application dashboard

Data is often considered the lifeblood of a business. For online companies and marketing teams, analyzing Facebook data becomes imperative to understand the market, audience behavior, and to make informed decisions. With a plethora of data metrics available, especially on platforms like Facebook, the challenge becomes not just collection, but effective interpretation and representation. Enter the era of automation with platforms like Octoboard, designed to simplify and optimize data reporting.

  • The Need for Software Platforms and SaaS Products

Traditional methods of Facebook data collection and analysis are time-consuming, prone to human error, and often do not present the holistic view required for strategic decision-making. Software platforms and SaaS (Software-as-a-Service) products streamline this process. They provide:

Save time by automating your reports, grow revenue and retain customers with Octoboard.

Efficiency: Automated data retrieval and representation speeds up the process, freeing up time for interpretation and strategy development.

Accuracy: Eliminate human errors associated with manual entry and calculations.

Real-time Analysis: Most online businesses operate 24/7, and so does their data. Real-time analytics provided by these platforms ensure you're always updated.

Customization: Tailor your reports based on what metrics matter most to your business, ensuring relevance and focus.

Save time by automating your reports, grow revenue and retain customers with Octoboard.

  • The Power of Automating Facebook Reporting with Octoboard

Facebook, being a prime platform for businesses to engage with their audience, provides a wealth of data. Octoboard stands out by automating the generation and representation of these essential metrics:

  • FACEBOOK LATEST POSTS & TOP POSTS

Understanding what content garners attention helps shape future content strategies. These metrics give insights into what's current and what's working.

  • FACEBOOK AUDIENCE Metrics

From PAGE FANS BY REGION to FANS BY LANGUAGE, understanding your audience's demographics and preferences is the foundation of targeted marketing. Octoboard's automation ensures these metrics are always updated and at your fingertips.

Monitor your ad spend budget, save costs and increase your paid advertising ROI with Octoboard.

  • FACEBOOK IMPRESSIONS, REACH, and REFERRERS

These metrics are vital to gauge the visibility and reach of your content. Whether organic or paid, knowing how far your content travels and from where traffic originates helps in optimizing ad spends and content placement.

  • FACEBOOK ENGAGEMENT Metrics - LIKES, CLICKS, and ACTIONS

Engagement indicates audience interest and interaction. Metrics like COMMENTS, SHARES, and POSITIVE FEEDBACK TRENDS provide a clear picture of how your audience perceives your content. Higher engagement often translates to higher conversions.

Build marketing reports and keep track of your SEO and keywords rankings with Octoboard.

  • NEGATIVE ACTIONS and UNLIKES

It's not just the positive metrics that matter. Understanding what deters your audience helps in rectifying mistakes and avoiding them in future campaigns.

  • STORIES and STORY IMPRESSIONS

With the growing popularity of 'Stories' on various social platforms, measuring their impact is crucial. Story impressions give insights into how many times your story was viewed, assisting in understanding its effectiveness.

Tips
We recommend breaking down your Facebook metrics into the following areas:
  • Your Facebook posts popularity and user feedback
  • Audience insights (age, gender, location)
  • Content reach
  • Traffic sources
  • Facebook ads efficiency
  • Engagement
  • Negative feedback
Notes
To connect to Facebook, use your standard login. Make sure you enable access to your Facebook pages. Here is how to check it: octoboard.com/support/connecting-to-facebook
3,612
TRY IT NOW
Last reviewed:
9-Oct-24
Dashboards:
Reports:
Client portals:
White label:
Data refresh:
OpenAI Data insights:
Office TV output:
Multi-client:

Automated data reports enabled by Octoboard software

Click for details...
OCTOBOARD dashboards, templates and reports gallery: Facebook overview template

FACEBOOK OVERVIEW

Key Facebook metrics for Social Media marketing dashboard.
Click for details...
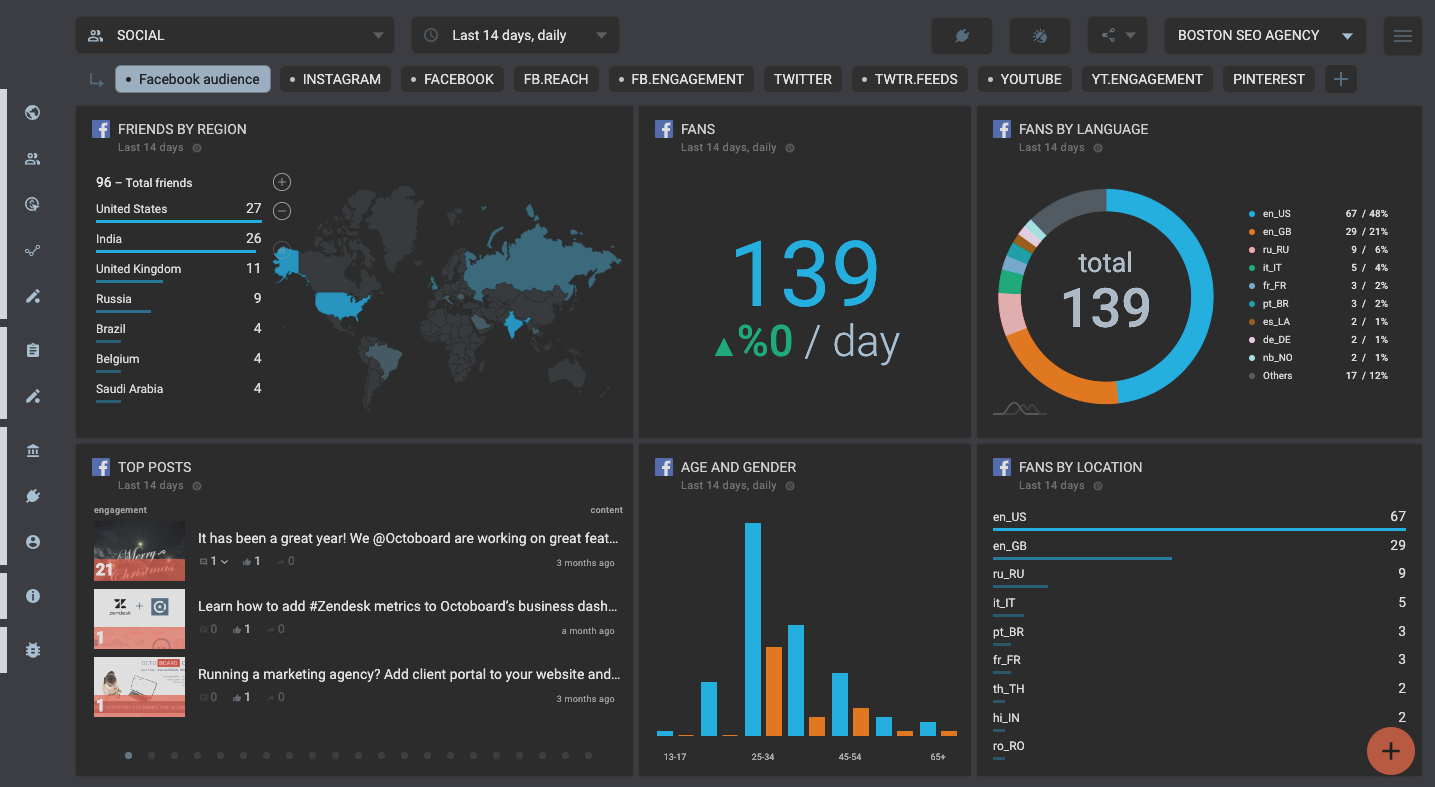
OCTOBOARD dashboards, templates and reports gallery: Facebook audience template

FACEBOOK AUDIENCE

Facebook metrics for audience monitoring and analysis.
Click for details...
OCTOBOARD dashboards, templates and reports gallery: Facebook reach template

FACEBOOK REACH

Group of Facebook metrics covering content and reach (paid, organic, viral).
Click for details...
OCTOBOARD dashboards, templates and reports gallery: Facebook social media dashboard for marketing agencies

FACEBOOK SOCIAL MEDIA DASHBOARD - OVERVIEW

Key Facebook dashboard metrics for Marketing Agencies and Clients
Click for details...
OCTOBOARD dashboards, templates and reports gallery: Facebook reach and engagement automated report

FACEBOOK SOCIAL MEDIA REPORT TEMPLATE (REPORT)

Key Facebook Social metrics for Marketing Agency clients
Click for details...
OCTOBOARD dashboards, templates and reports gallery: Facebook reach social media dashboard

FACEBOOK SOCIAL MEDIA TEMPLATE - REACH
Facebook Social metrics for Marketing Agency clients - Reach
Click for details...
OCTOBOARD dashboards, templates and reports gallery: Facebook social media template audience

FACEBOOK SOCIAL MEDIA TEMPLATE - AUDIENCE METRICS

Facebook Social Media dashboard - audience widgets for marketing departments
Click for details...
OCTOBOARD dashboards, templates and reports gallery: Facebook engagement metrics in social media dashboard

FACEBOOK SOCIAL MEDIA DASHBOARD TEMPLATE - ENGAGEMENT

Facebook Engagement metrics for Marketing Agency client dashboard

Facebook metrics

Can I track my Facebook post popularity and audience feedback in real-time?
It is important to know when your audience reads and reacts to your content. Engage with your readers when you have their attention. The more timely and responsive you are the higher will be overall engagement. For active social network users, it is important to be able to check user feedback without the need to log in and out of websites. Use an online social media dashboard for Facebook to watch engagement in popular social networks without constantly switching between accounts.

OVERVIEW

Key Facebook Page metrics in one widget.
Description
This widget combines the following metrics displayed on the same time scale: Reach, Fans, Clicks, Shares, Likes, Comments.
Tips
Make sure you select correct Facebook Page. We recommend OVERVIEW widget for your main dashboard as it offers a high level view of your Facebook account.
USE THIS METRIC

PERFORMANCE

Impressions (page displays), Reach (number of people) and Engagement (sum of clicks, likes and shares) over a period of time.
Description
Impressions is the number of times a post from your Page is displayed. People may see multiple impressions of the same post. For example, if someone sees a Page update in News Feed and then sees that same update when a friend shares it that would count as 2 impressions. Reach is the number of people who received impressions of a Page post. Reach might be less than impressions since one person can see multiple impressions. For example, if a person sees a Page update in News Feed and then sees that same update when a friend shares it that would represent a reach count of one. Likes is the number of times people Like your posts. Likes are an indicator of how well your content resonates with people. Comments is the number of comments people make on your posts. Comments can provide insight into how people feel about your content, products or brand overall. Shares is the number of times people share your content. Shares measure how much your content is amplified by those who see it. Engagement is the total number of people who engagement with your content, including clicking on page links.
USE THIS METRIC

LATEST POSTS

Recent posts with Likes and Comments sorted by date (latest posts first).
Description
We use Engagement to rank your Facebook content. Latest Posts widget sorts posts by time of creation. Most recent posts are at the top. Post Engagement is calculated using the sum of weighted user actions. We applied different weightings to actions. Because comments, for example, are more valuable than Likes.
Post Engagement = Likes x 1 + Comments x 20 + Shares x 30
Last 20 posts will be displayed.
Tips
We recommend placing Latest Posts widget in your most frequently used dashboard. As each post shows actions of users (likes, shares and comments), you can always spot user activity as soon as it takes place. By commenting back or thanking your visitors for likes or shares you dramatically increase Engagement rate and boost popularity of your account. To increase level of Engagement, make sure your dashboards are refreshed frequently. Free accounts do not update dashboard data more than once per day. For real-time dashboards, switch to a premium account.
USE THIS METRIC

TOP POSTS

Top posts with Likes and Comments sorted by Engagement.
Description
Your posts are ranked by Engagement. Most engaging posts are shown at the top. If you want to sort your posts by date (latest posts at the top), select different sorting or pick Latest Posts widget. Engagement is calculated using the sum of weighted user actions. We applied different weightings to actions. Because comments, for example, are more valuable than Likes.
Engagement = (Likes x 1 + Comments x 20 + Shares x 30)
Maximum of 20 posts will be displayed in this widget.
Tips
Do not confuse Engagement with Engagement Rate. They are different metrics. Engagement Rate is calculated by dividing the sum of all actions (not weighted) by Reach (number of people who have seen your ads. Reach and Engagement Rate are standard Facebook metrics. For more information about Facebook metrics, make sure you visit our "Facebook Analytics guide" that explains above in more details.
USE THIS METRIC
What is my audience’s age and gender? Where are they from?
Understanding your audience is extremely important. You can use this information to rank your traffic sources, to uncover business opportunities, to build sales strategy and much more. Start from understanding your viewers’ age, gender and geographical information. Combine it with TRAFFIC SOURCES, ENGAGEMENT RATE.

PAGE FANS BY REGION

Countries where your friends and fans are from.
Description
Please note that a maximum of 45 countries can be displayed. Therefore Total number of fans may be larger than what is show on the map.
Tips
Understanding your audience is extremely important. You can use this information to rank your traffic sources, to uncover business opportunities, to build sales strategy and much more. Start from understanding your viewers’ age, gender and geographical information. Combine it with Traffic Sources and Engagement Rate.
USE THIS METRIC

PAGE FANS

Number of people that like your page.
Description
In Page Insights and other places on Facebook, fans is another way to refer to the people who like your Page.
Tips
You can always change presentation of this metric converting it to a numeric representation or adding a target (number of funs you want to have in the future) or a delta (how much fans count changed in the last period).
USE THIS METRIC

NEW PAGE FANS

View the number of new people that like your Page by day.
Description
In Page Insights and other places on Facebook, fans is another way to refer to the people who like your Page.
Tips
You can always change presentation of this metric converting it to a numeric representation or adding a target or delta.
USE THIS METRIC

FANS BY LANGUAGE

Top languages of your audience.
Tips
Use this metric to understand your audience and make your content more relevant and improve engagement.
USE THIS METRIC

PAGE FANS BY CITY

Top cities that your audience is from.
USE THIS METRIC
How often do people see my Facebook content?
REACH is a great metric. It tells you how many people are shown (reached by) your content (or ads). Not all social networks report user counts. Instead, they report counts of views or IMPRESSIONS and view FREQUENCY. Use REACH to evaluate and fine-tune definitions of your ad campaigns. It is useful to track it over time and correlate with actions such as LIKES. If your content REACH grows but LIKES count declines this could be an indication of low content relevance.

IMPRESSIONS AND REACH

Impressions and reach of your Facebook page content over time.
Description
Impressions are the number of times a post from your Page is displayed. People may see multiple impressions of the same post. For example, if someone sees a Page update in News Feed and then sees that same update when a friend shares it that would count as 2 impressions. Reach is the number of people who received impressions of a Page post. Reach might be less than impressions since one person can see multiple impressions. For example, if a person sees a Page update in News Feed and then sees that same update when a friend shares it that would represent a reach count of one.
Tips
Combine Impressions and Reach counters with Engagement. If you are a marketing agency or a business, we recommend including them in your regular scheduled reports for your clients or organisation marketing department. For more insights into paid traffic, we suggest trying out to our Facebook Ads Automated Reporting.
USE THIS METRIC

IMPRESSIONS

Number of times your page activity is displayed to your audience tracked over time.
Description
Impressions is the number of times a post from your Page is displayed. People may see multiple impressions of the same post. For example, if someone sees a Page update in News Feed and then sees that same update when a friend shares it that would count as 2 impressions.
USE THIS METRIC
Do people come to my page after seeing Facebook Ads?
REACH tells you how many people are shown (reached by) your content (or ads or posts). Facebook can report REACH based on how people access your Facebook – organically (by just browsing Facebook or Internet) or paid (as a result of clicking on Facebook Ads). You should use this to evaluate effectiveness of your Facebook Ad campaigns.

IMPRESSIONS PAID VS ORGANIC

Impressions over time - paid vs organic.
Description
Impressions is the number of times a post from your Page is displayed. People may see multiple impressions of the same post. For example, if someone sees a Page update in News Feed and then sees that same update when a friend shares it that would count as 2 impressions. Organic Impressions is the number of times your content was displayed in a News Feed, ticker, or on your page. Paid Impressions is the number of times your paid content was displayed. Facebook can report Impressions counts based on how people access your content – organically or as a result of clicking on Facebook Ads.
Tips
Use this metric to evaluate effectiveness of your Facebook Ad campaigns. For more insights into paid traffic, we suggest trying out to our Facebook Ads Automated Reporting.
USE THIS METRIC

PAID VS ORGANIC REACH

Paid vs Organic reach over time.
Description
Reach is the number of people who received impressions of a Page post. Reach might be less than impressions since one person can see multiple impressions. For example, if a person sees a Page update in News Feed and then sees that same update when a friend shares it that would represent a reach count of one. Reach is called Paid if people received impressions through paid advertising (Facebook Ads). Organic Reach metric only counts people who visited the website through "organic" or non-paid leads.
Tips
Watch both metrics to understand how effective your Facebook Ads are. For more insights into paid traffic, we suggest trying out to our Facebook Ads Automated Reporting.
USE THIS METRIC
How viral is my content? Do other Facebook users talk about and spread it further?
Great content can become viral. It happens when others start talking about your articles or posts, add links and spread the word. Friends of your friends pick it up and become your audience and so on. When it happens it is almost always a great news. If your content becomes viral, it is important to understand why and hopefully repeat the success. VIRAL REACH metrics help to identify these moments. Revisit your viral content and learn from it to make your future posts and pages even better.

VIRAL REACH

Viral reach count over time (number of people who saw your content published or linked by your friends).
Description
Reach is the number of people who received impressions of a Page post. Reach might be less than impressions since one person can see multiple impressions. For example, if a person sees a Page update in News Feed and then sees that same update when a friend shares it that would represent a reach count of one.
USE THIS METRIC

VIRAL IMPRESSIONS

Number of viral impressions over time.
Description
Viral Impressions is the number of times content on your Facebook page was displayed in a story published by a friend.
USE THIS METRIC
Is my Facebook content gaining popularity?
Counting LIKES, CLICKS and trending them over time show how interesting or popular your Facebook content is. It could be useful to combine it with ENGAGEMENT metrics.

PAGE LIKES

Page content Likes by day.
Description
Likes is the number of times people Like your posts. Likes are an indicator of how well your content resonates with people.
USE THIS METRIC

IMPRESSIONS AND LIKES

Number of times pages have been displayed and liked.
Description
Impressions is the number of times a post from your Page is displayed. People may see multiple impressions of the same post. For example, if someone sees a Page update in News Feed and then sees that same update when a friend shares it that would count as 2 impressions. Likes is the number of times people Like your posts. Likes are an indicator of how well your content resonates with people.
USE THIS METRIC

UNLIKES

Page content Unlikes by day.
Tips
Keep an eye on negative feedback. It is very important that you quickly react to visitors’ feedback. If Negative Actions count increases, it may be an indication that you are either not active or not timely enough with your responses. Note that you can always change presentation of this metric from historic trend to current numeric value (count of unlikes today).
USE THIS METRIC
Can I monitor stories published about my Facebook Page?
Stories include liking your Page, posting to your Page’s Wall, liking, commenting on or sharing one of your Page posts, answering a Question you posted, RSVPing to one of your events, mentioning your Page, photo-tagging your Page or checking in at your Place.

STORIES

The number of stories published by friends about your Facebook Page.
Description
Stories include liking your Page, posting to your Page's Wall, liking, commenting on or sharing one of your Page posts, answering a Question you posted, RSVPing to one of your events, mentioning your Page, photo tagging your Page or checking in at your Place.
USE THIS METRIC

STORY IMPRESSIONS

The number of impressions of stories published by a friend about your Facebook Page.
USE THIS METRIC

STORY TYPES

Story types ranked by count of stories.
USE THIS METRIC
Get more value out of your cloud data. Start using performance metrics now.
GET OCTOBOARD FREE